
Figure 7.
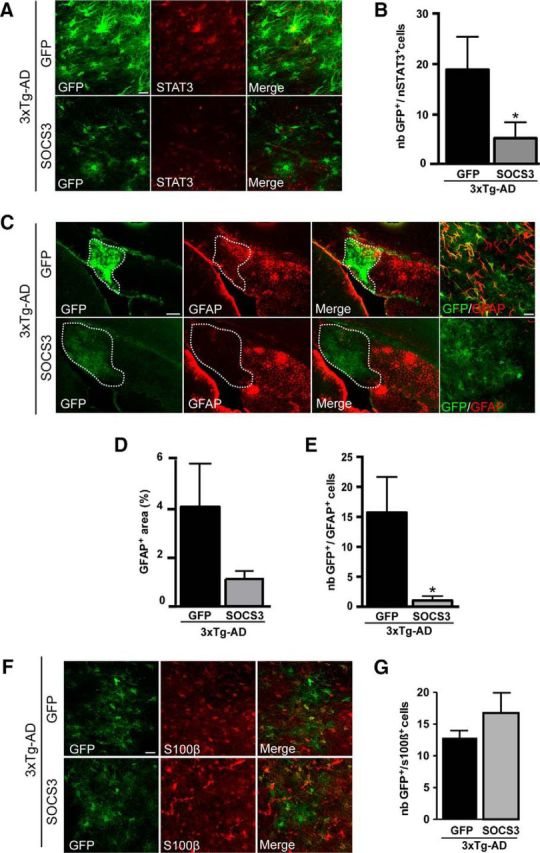
The JAK/STAT3 pathway is responsible for astrocyte reactivity in 3xTg-AD mice. A, Images of double staining for GFP (green) and STAT3 (red) in 7- to 8-month-old 3xTg-AD mice injected in the subiculum with lenti-GFP or lenti-SOCS3 plus lenti-GFP (same total virus load). STAT3 expression becomes undetectable in astrocytes infected with lenti-SOCS3. B, The number of GFP+ astrocytes coexpressing STAT3 in the nucleus (GFP+/nSTAT3+ cells) is significantly lower in the SOCS3 group than in the GFP control group. C, Images of GFP (green) and GFAP (red) staining in brain sections from 3xTg-AD mice injected with lenti-GFP or lenti-SOCS3 plus lenti-GFP in the subiculum. Lenti-SOCS3 injection strongly reduces GFAP expression in the injected area (delimited by white dots) in 3xTg-AD mice. Note that infected astrocytes in the SOCS3 group have a bushy morphology typical of resting astrocytes, whereas cells in the GFP group are hypertrophic with enlarged primary processes. D, Quantification of the GFAP+ area in 3xTg-AD mice injected with lenti-SOCS3 plus lenti-GFP or lenti-GFP alone. E, The number of GFP+ astrocytes coexpressing GFAP is significantly lower in the SOCS3 group than in the GFP control group. F, Immunofluorescent labeling for the astrocyte marker S100β. G, Quantification of the number of infected astrocytes coexpressing S100β (GFP+/S100β+ cells) shows that its expression is not altered by SOCS3. n = 3–5 per group. *p < 0.05. Scale bars: A and F, 20 μm; C, left, 500 μm; right, 20 μm. Infected astrocytes in both groups are identified by their expression of GFP.