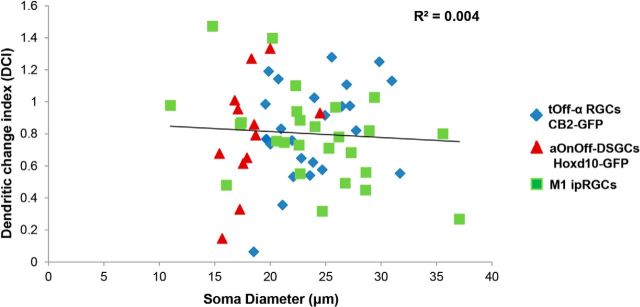
Figure 10.
RGC dendritic susceptibility is not correlated to soma size. Scatter plot showing lack of correlation between soma size and the DCI for RGC subtype that showed changes in IOP-elevated retinas. Different colors represent the distinct subtypes of RGCs. Line represents a linear regression fit, with the r2 value of 0.004.

