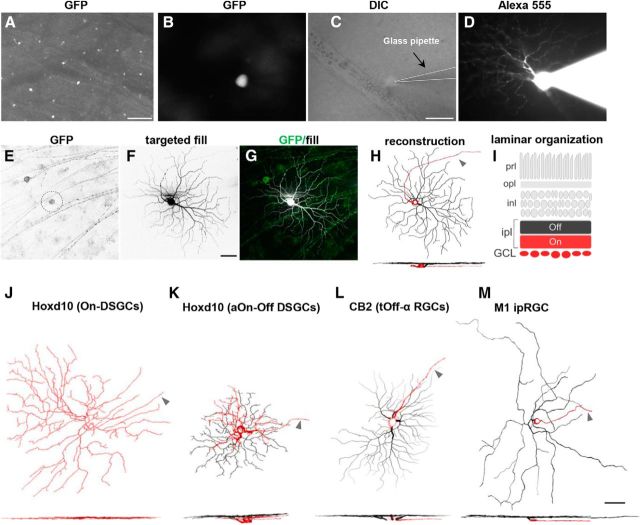
Figure 2.
Transgenic mouse lines for examination of the effects of elevated IOP on specific, distinct subtypes of RGCs. A, Whole-mount retina, with GFP-expressing RGCs. Scale bar, 100 μm. B–D, Individual GFP-expressing RGCs (B) targeted with a glass pipette (C) and filled with fluorescent dye to reveal its complete dendritic structure (D). Scale bar: (in C) B–D, 50 μm. E–H, Maximum intensity projection images showing the morphology of an individual RGC that was GFP+ (E) and filled with Alexa Fluor 555 (F). G, Merged image. Green, GFP; white, targeted fill. H, Neurolucida three-dimensional reconstruction of cell body, proximal axon, dendritic branching, and stratification depth. I, Schematic of laminar organization of the retina. The vitreal or “On sublamina” half of the inner plexiform layer (ipl) is shown in red. The scleral “Off sublamina” half of the ipl is in black. prl, photoreceptor layer; opl, outer plexiform layer; inl, inner nuclear layer; GCL, ganglion cell layer. J–M, Lucida reconstructions of representative examples of each of the RGC subtypes examined in this study: On DSGCs (J) and aOn-Off DSGC (K) labeled in Hoxd10-GFP transgenic mice; tOff-α RGCs (L) labeled in CB2-GFP transgenic mouse mice; and type-M1 ipRGCs (M) visualized through immunostaining with anti-melanopsin antibodies. Dendritic stratification patterns are shown below as side-view images (red: soma, axon, and dendrites localized to On sublamina; black: dendrites localized to the Off sublamina). Arrowheads in H and J–M indicate the axon (red). Scale bar, 50 μm.

