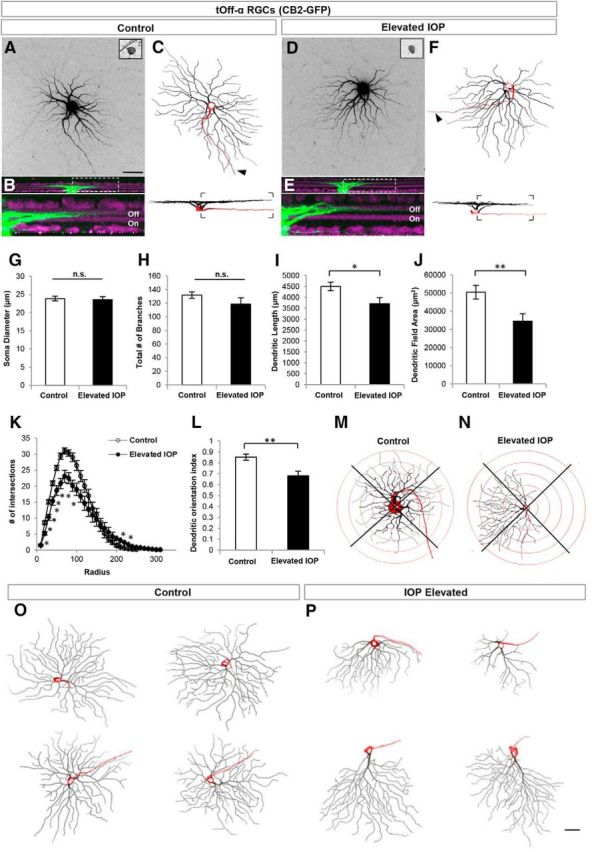
Figure 3.

tOff-α RGCs rapidly alter their dendritic structure in response to elevated IOP. A–F, Maximum intensity projection confocal images of tOff-α RCCs from control (A–C) and IOP-elevated retinas (D–F). CB2-GFP somas (A, D, inset image) were filled with Alexa Fluor 555 hydrazide dye (A, D) and reconstructed (C, F). Arrowhead, Axon. B, E, Side views showing the stratification depth of the dendritic arbor within the Off sublamina (green, cell fill; purple, ChAT and VAChT immunostaining; bottom panels show area in dotted rectangle). G–L, Quantification of various morphological parameters examined for RGCs in control (white bars) and IOP-elevated/bead-injected (black bars) eyes. No significant differences (n.s.) were found in soma diameter (G) and total number of dendritic branches (H). Dendritic length (I; t test *p < 0.05) and dendritic field area of tOff-α RGCs were significantly reduced in IOP-elevated retinas (J; t test **p < 0.01), which was corroborated by Sholl ring analysis (K; t test statistical significance: 20–90 μm, *p < 0.001; 100–110 μm, *p < 0.01; 210–220 μm, *p < 0.05), and DOi analysis (L, **p < 0.01). M, N, representative example of the Sholl ring analysis used to generate the dendritic orientations values in L for control (M) and IOP-elevated neurons (N). For G–L, error bars represent ± SEM; O, P, Examples of tOff-α RGCs obtained from control retinas (O) and IOP-elevated retinas (P). Side views shown at the bottom of each neuron (red: soma and axon; black: Off sublamina dendrites). Scale bars: A, P, 50 μm.
