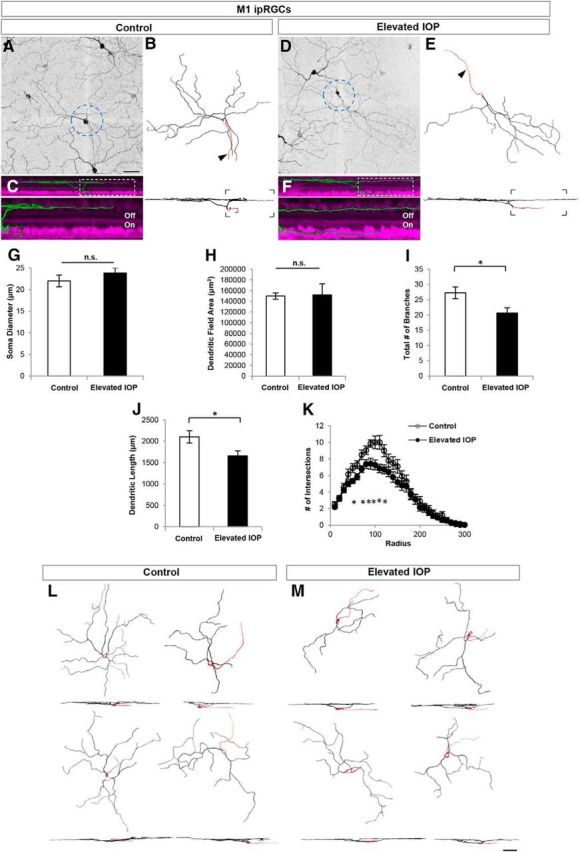
Figure 8.

M1 ipRGCs have reduced dendritic branching in response to elevated IOP. A–E, Maximum-intensity projection images showing the morphologies of M1 ipRGCs obtained by immunostaining for melanopsin in control (A–C) and IOP-elevated retinas (D–F). Reconstructed M1 cells (B, E; arrow, axon). G–K, Quantitative morphological comparison of control (white bars) and IOP-elevated (black bars) RGCs showed no significant differences (n.s.) for soma diameter (G) and dendritic field area (H). Reduction was significant for total number of branches (I) and dendritic length (J). K, Sholl analysis showing reduction of branches along distinct locations of the dendritic arbor denoted by asterisks. For G–K, error bars represent ±SEM; t test *p < 0.05. L, M, Representative examples of M1 ipRGCs are shown from control (L) and IOP-elevated (M) retinas. Scale bars: A, M, 50 μm.
