
Figure 5.
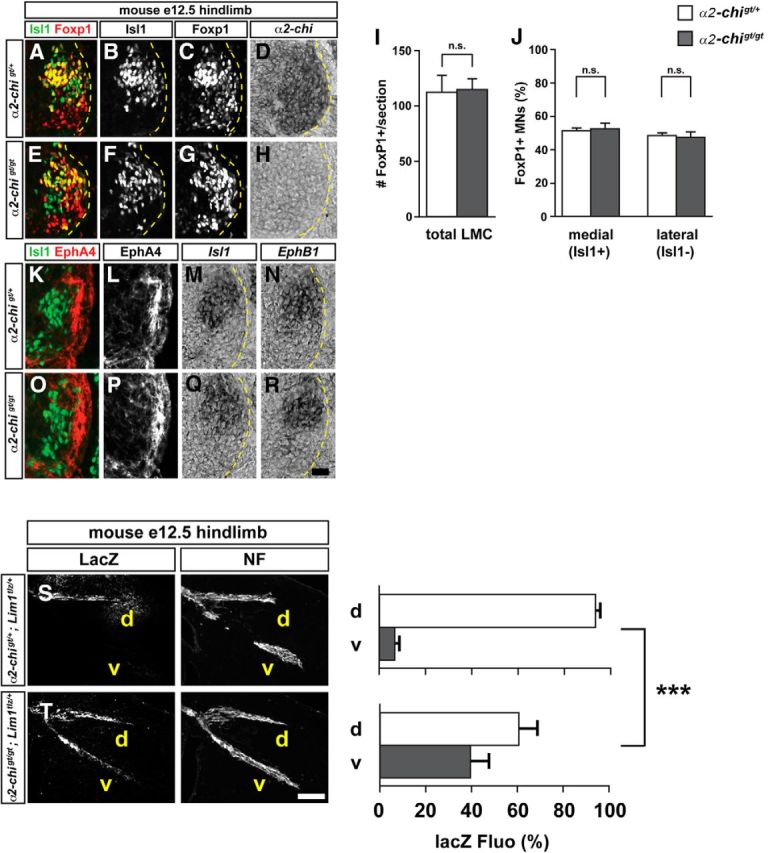
α2-chimaerin is required for the selection of LMC axon trajectory. A–H, Detection of Isl1 (green), and Foxp1 (red) protein and α2-chimaerin mRNA in the LMC region at the lumbar level of control α2-chi gt/+(A–D) or α2-chi gt/gt (E–F) e12.5 mouse embryos. I, Number of LMC motor neurons expressed as the average number of total (Foxp1+) LMC neurons per section (# FoxP1+/section). J, Number of total medial (FoxP1+ Isl1+) and lateral (FoxP1+ Isl1−) LMC motor neurons in lumbar spinal cord expressed as the percentage of total motor neurons [FoxP1+ MNs (%)]. K–R, Detection of Isl1 (green) and EphA4 (red) protein, Isl1 and EphB1 mRNA in the spinal cord of mouse e12.5 α2-chi gt/+ (K–L) or α2-chigt/gt (O–R) embryos. The expression and localization of EphA4, EphB1, and Isl1 in LMC are not obviously changed compared with control littermates. Number of embryos quantified: n = 7 for all experimental groups. Error bars indicate SD; n.s., not significant. Scale bars: A–H, 20 μm; K–R, 15 μm. S, T, LacZ and neurofilament detection in the hindlimb nerves of e12.5 α2-chigt/+; Lim1tlz/+ (S) or α2-chigt/gt; Lim1tlz/+ (T) mice. Quantification of LacZ signals in both groups expressed as, respectively, percentage in dorsal and ventral limb nerves [lacZ Fluo Int (%)]. Number of embryos: n = 6 (S), 7 (T). d, Dorsal; v, ventral; NF, neurofilament; α2-chi, α2-chimaerin. Error bars indicate SD; ***p < 0.001; **p < 0.01; statistical significance computed using Student's unpaired t test; all values are mean ± SD. Scale bars in A–D, 120 μm.