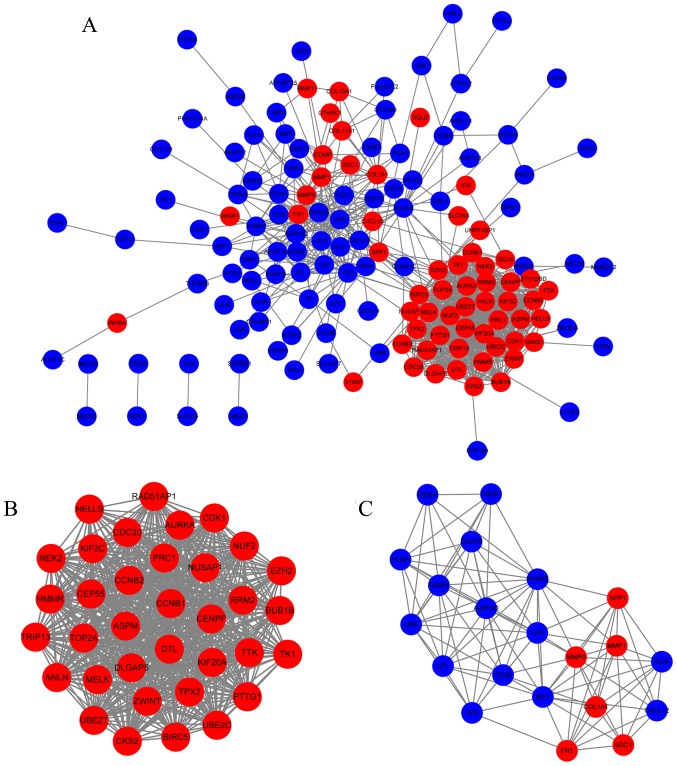
Figure 3.
PPI network analysis of DEGs. (A) PPI network containing 149 nodes and 930 edges. (B) Module 1 consisted of 35 nodes and 573 edges, as identified by the MCODE plugin in Cytoscape. (C) Module 2 consisted of 21 nodes and 104 edges, as identified by the MCODE plugin in Cytoscape. Blue nodes represent downregulated genes in BC tissues; red nodes represent upregulated genes in BC tissues. PPI, protein-protein interaction; DEG, differentially expressed genes; BC, breast cancer; MCODE, Molecular Complex Detection.

