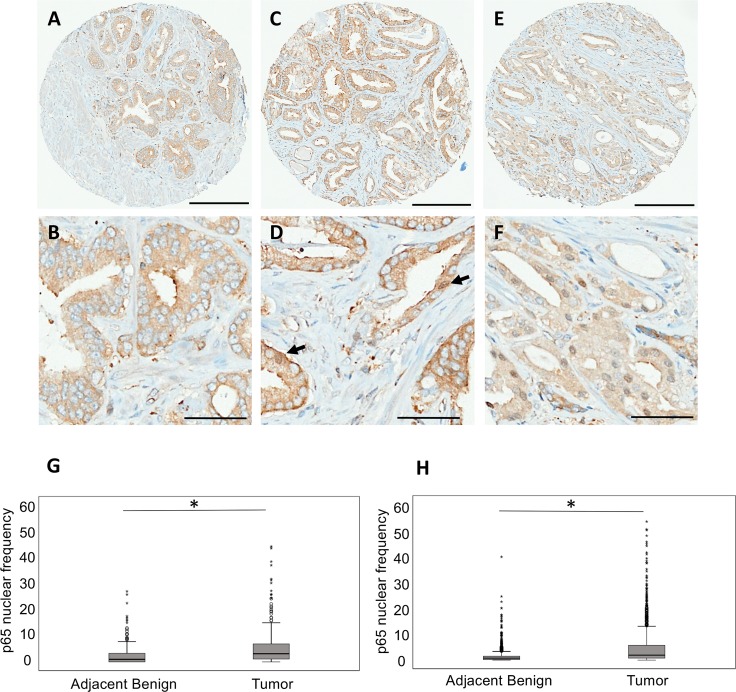
Fig 1. Nuclear localization of p65 in prostate cancer tissues.
Representative images of p65 immunostaining on TMA cores of prostate cancer. (A, B) Negative nuclear staining (negative), (C, D) ≤3% positive nuclear staining (low expression), and (E, F) >3% positive nuclear staining (high expression). Arrows in (D) indicate rare positive nuclei. Scale bars, 200 μm (A, C, E) and 50 μm (B, D, F). Box plot representation of the nuclear frequency of p65 in benign adjacent and tumor cores of the Test-TMA (G) and Validation-TMA (H). *p < 0.001 (Mann–Whitney U test).

