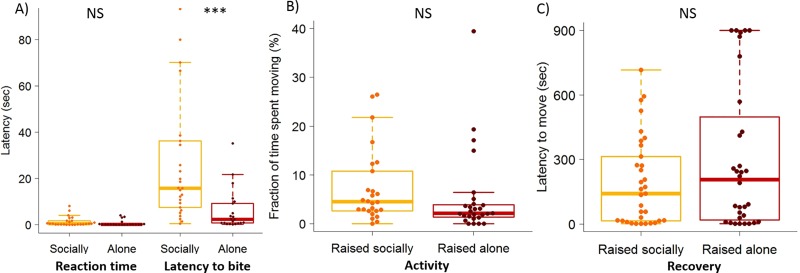
Fig 6. Social isolation influences aggressiveness toward a prey but not the activity level nor the latency to recover after an aversive stimulation.
(A) Reaction time and latency to bite a prey introduced to a test arena containing a single spiderling raised socially (N = 22) or in isolation (N = 21) for 15 days before the test. (B) Fraction of time spent moving by single spiderlings in an open arena (diameter: 55 mm) for 30 min after they were raised alone (N = 27) or in groups (N = 26) for 15 days. (C) Latencies to resume activity after being stimulated with an air puff for individuals raised socially (N = 33) or alone (N = 32). In each box plot, a dot indicates the score of each spiderling. Horizontal line in each box represents the median, and the lower and upper hinges indicate the first and third quartiles. Lower and higher whiskers extend to the most extreme values within 1.5 interquartile ranges from the first and third quartiles respectively. Significant difference is indicated by *** (t test, P < 0.001), NS indicates non-significant differences. Relevant data values are included in S1 Data.

