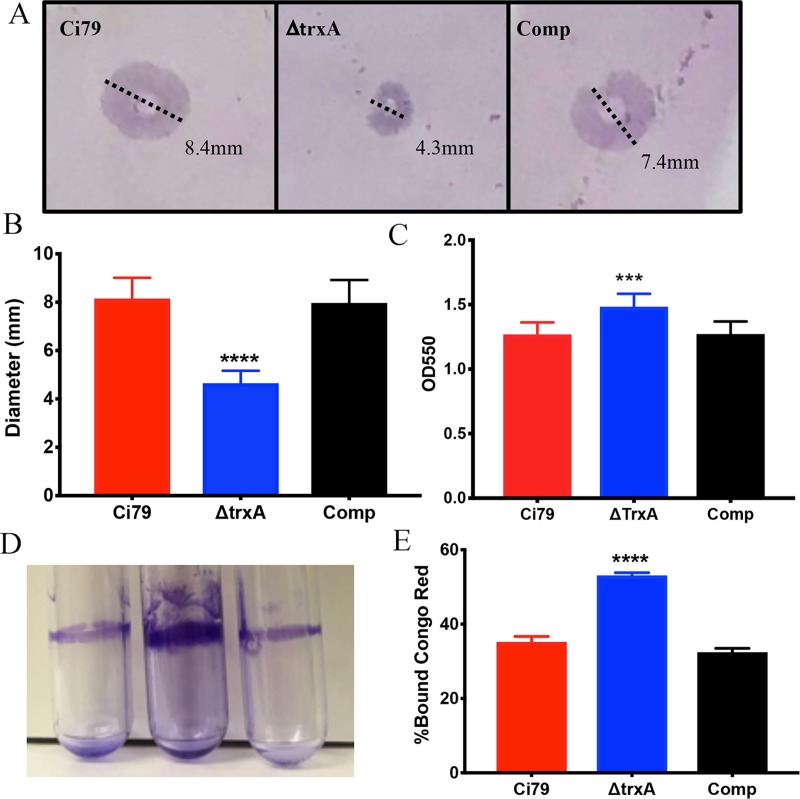
Fig 3. Comparison of growth characteristics and phenotype of wild type (Ci79), trxA mutant, and complemented bacterial strains.
Twitching motility was measured by growing bacteria in a 0.3% LB agar plate that had been inoculated at the agar/plate interface. (A) Representative images depicting motility measurement, and (B) overall spreading distance (mean ± SD). Biofilm was measured by growing bacteria for 24 hrs in a static incubator at 37 oC. (C) Quantitation of biofilm formation in 96 well format. (D) Visual comparison of biofilm formation in polystyrene tubes. Congo Red binding (E) was assessed on mid-log phase bacteria. Error bars represent SD. Bar charts represent one set of data from 3 independent studies, each consist of 6 samples for each bacterial strain. Statistical differences were determined by two-way ANOVA with Holm-Sidak correction for multiple comparisons (***P < 0.001, ****P < 0.0001).

