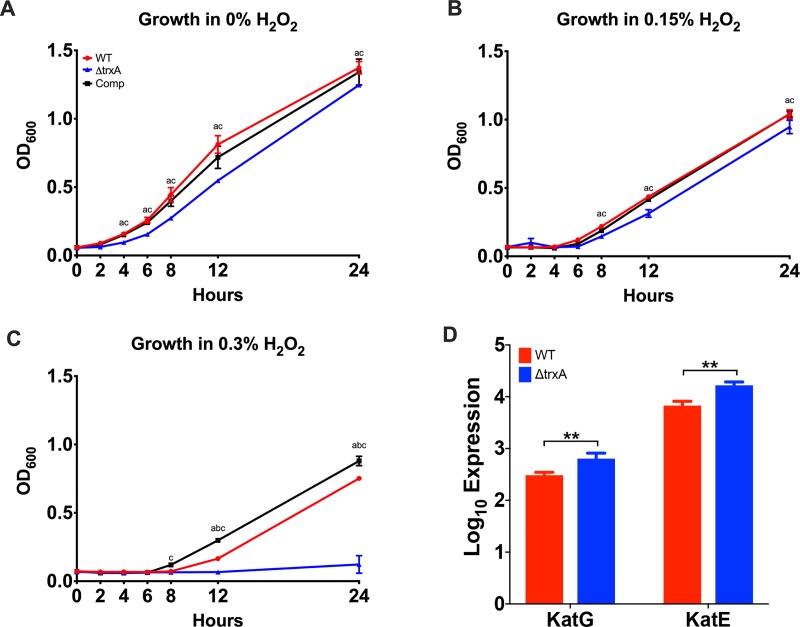
Fig 4. Comparison of the effects of hydrogen peroxide on WT, ΔtrxA, and Comp bacterial strains.
(A-C) Growth curve of bacteria grown in the absence and presence of hydrogen peroxide. Representative of 3 independent experiments, n = 6 per bacterial strain. a = significant between groups 1&2, b = significant between groups 1&3, c = significant between groups 2&3. Statistical differences were determined by two-way ANOVA with Holm-Sidak correction (P < 0.05). (D) Transcription analysis of catalase genes, KatG and KatE, by RNA-seq. **, P < 0.005.

