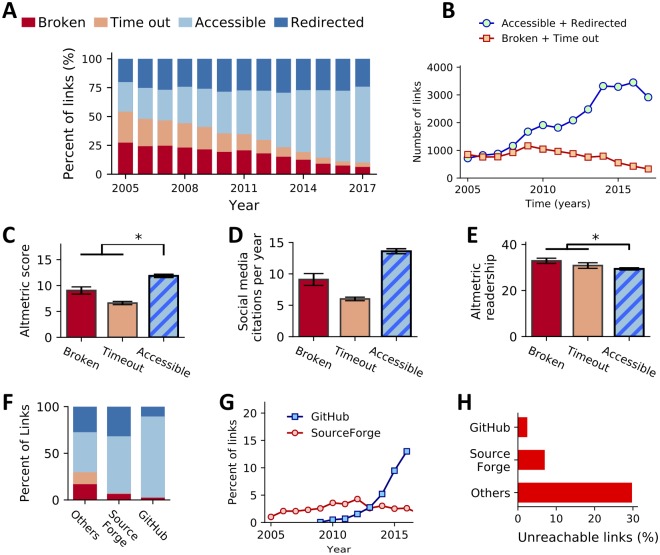
Fig 1. Archival stability of 36,702 published URLs across 10 systems and computational biology journals over the span of 13 years.
An asterisk (*) denotes categories that have a difference that is statistically significant. Error bars, where present, indicate SEM. (A) Archival stability status of all links evaluated from papers published between 2005 and 2017. Percentages of each category (y-axis) are reported over a 13-year span (x-axis). (B) A line graph comparing the overall numbers (y-axis) of functional (green circles) and nonfunctional (orange squares) links observed in papers published over time (x-axis). (C) A bar chart showing the mean Altmetric “attention score” (y-axis) for papers, separated by the status of the URL (x-axis) observed in that paper. (D) A bar chart showing the mean number of mentions of papers in social media (blog posts, Twitter feeds, etc.) according to Altmetric, divided by the age of the paper in years (y-axis). Papers are separated by the status of the URL (x-axis) found in the paper. (E) A bar chart illustrating the mean Altmetric readership count per year of papers (y-axis) containing URLs in each of the categories (x-axis). (F) The proportion of unreachable links (due to connection time-out or due to error) stored on web services designed to host source code (e.g., GitHub and SourceForge) and “Other” web services. (G) A line plot illustrating the proportion (y-axis) of the total links observed in each year (x-axis) that point to GitHub or SourceForge. (H) A bar chart illustrating the proportion of links hosted on GitHub or SourceForge (vertical axis) that are no longer functional (horizontal axis) compared with links hosted elsewhere. SEM, standard error of the mean; URL, uniform resource locators.

