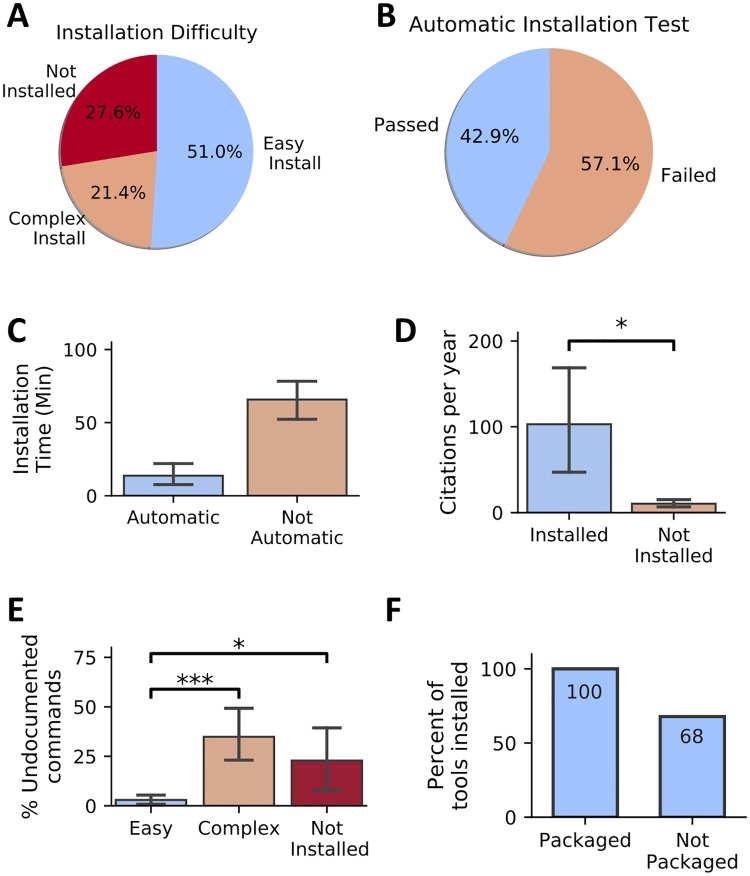
Fig 2. Installability of 98 randomly selected published software tools across 22 life-science journals over a span of 15 years.
Error bars, where present, indicate SEM. (A) Pie chart showing the percentage of tools with various levels of installability. (B) A pie chart showing the proportion of evaluated tools that required no deviation from the documented installation procedure. (C) Tools that require no manual intervention (pass automatic installation test) exhibit decreased installation time. (D) Tools installed exhibit increased citation per year compared with tools that were not installed (Kruskal–Wallis, p-value = 0.035). (E) Tools that are easy to install include a decreased portion of undocumented commands (Not Installed versus Easy Install: Mann–Whitney U test, p-value = 0.01, Easy Install versus Complex Install: Mann–Whitney U test, p-value = 8.3 × 10⁻⁸). (F) Tools available in well-maintained package managers such as Bioconda were always installable, whereas tools not shipped via package managers were prone to problems in 32% of the studied cases. SEM, standard error of the mean.

