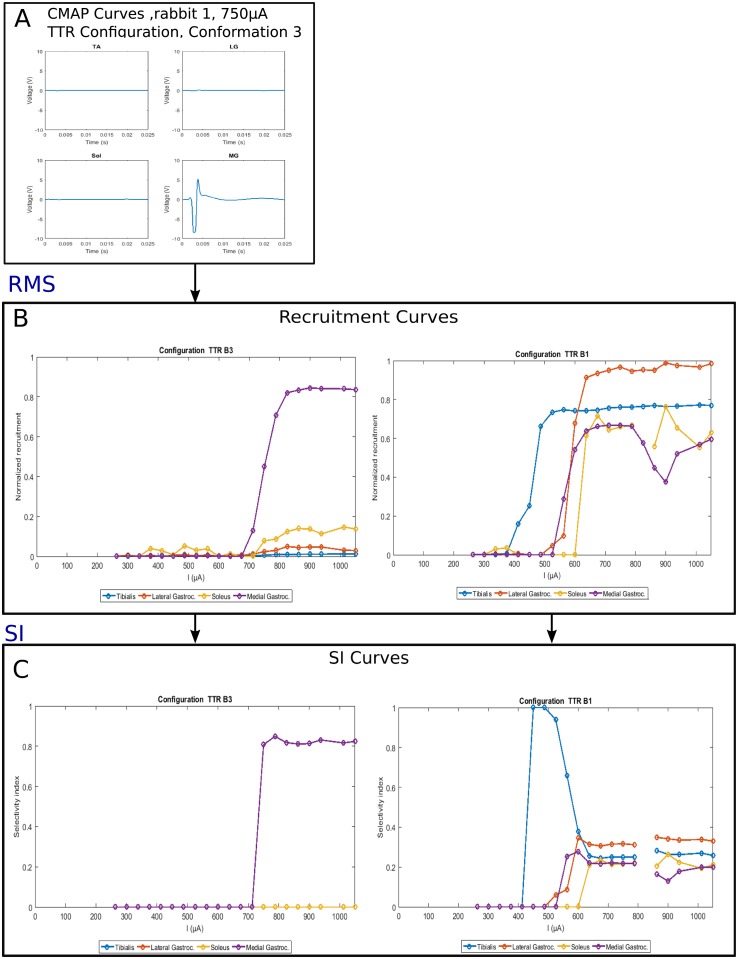
Fig 4. Different steps of the signal processing illustrated through data from Rabbit 1 with TTR configuration.
A example of CMAPs collected for each muscle, configuration TTR(B3). B Recruitment curves obtained after the computation of RMS: TTR(B3) (left) and TTR(B1) (right). C Selectivity curves obtained for TTR(B3) (left) and TTR(B1) (right). Missing point corresponds to data that could not be recorded.

