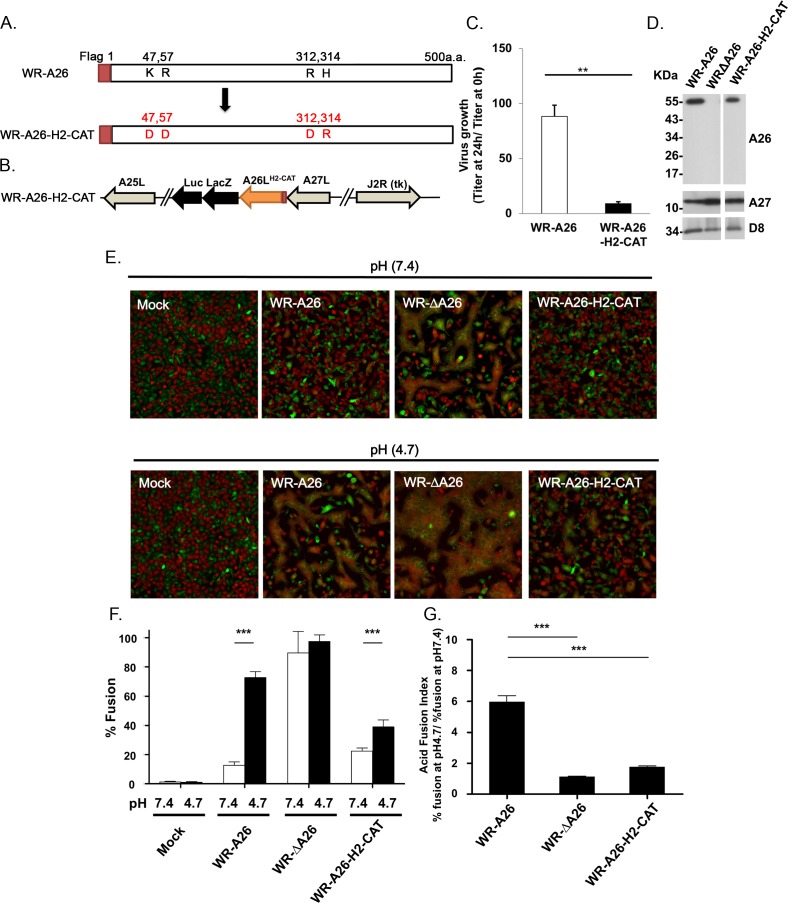
Fig 6. Generation of A26 mutant vaccinia viruses containing K47D, R57D, R312D and H314R mutations in A26 protein (A26-H2-CAT).
(A). Schematic representation of full-length WR-A26 and mutant A26-H2-CAT proteins. Each construct contains flag-tag sequences at the N-terminus. (B). Genome arrangement of WR-A26-H2-CAT recombinant virus. The A26-H2-CAT gene cassette was inserted into the endogenous A26L locus and selected as blue plaques in agar plates containing X-gal. (C). One-step growth of the WR-A26 and WR-A26-H2-CAT viruses in HeLa cells. Cells were infected with each virus at an MOI of 5 PFU per cell for 60 min and then cells were washed and harvested at 0 and 24 hpi for virus titer determination. The Y-axis represents MV growth, which was determined by dividing virus titers at 24 hpi with the respective input virus titers at 0 hpi. The experiments were repeated three times and the Student t-test was used for statistical analysis. ** p < 0.01. (D). Immunoblots of WR-A26, WR-ΔA26 and WR-A26-H2-CAT mutant proteins in CsCl-purified MV particles. A27 and D8 proteins are two viral envelope proteins that served as positive controls. (E). Images of cell-cell fusion induced upon MV infection. Single-fluorescent cells as described in Fig 2A were infected with each virus at an MOI of 50 PFU per cell, washed with neutral or acidic pH buffer for 3 min, and then subjected to live-imaging to monitor cell-cell fusion at 37°C for 2 h. (F). Quantification of the % fusion of each virus described in E. Five images for each virus were recorded and the % fusion was calculated based on the ratio of image area of GFP+RFP+ double-fluorescent cells divided by that of single-fluorescent cells. *** p <0.001. (G). The Acid Fusion Index was calculated from data (in F) by dividing the % of cell fusion at low pH (the black bars) by that at neutral pH (the white bars). Endocytic WR-A26 had an Acid Fusion Index of ~5.96, whereas the indexes of other viruses were much lower, demonstrating a significantly reduced dependence on acidic environments for cell fusion. The experiments were repeated three times for each virus and the Student t-test was used for statistical analyses. *** p <0.001.

