Figure 4.
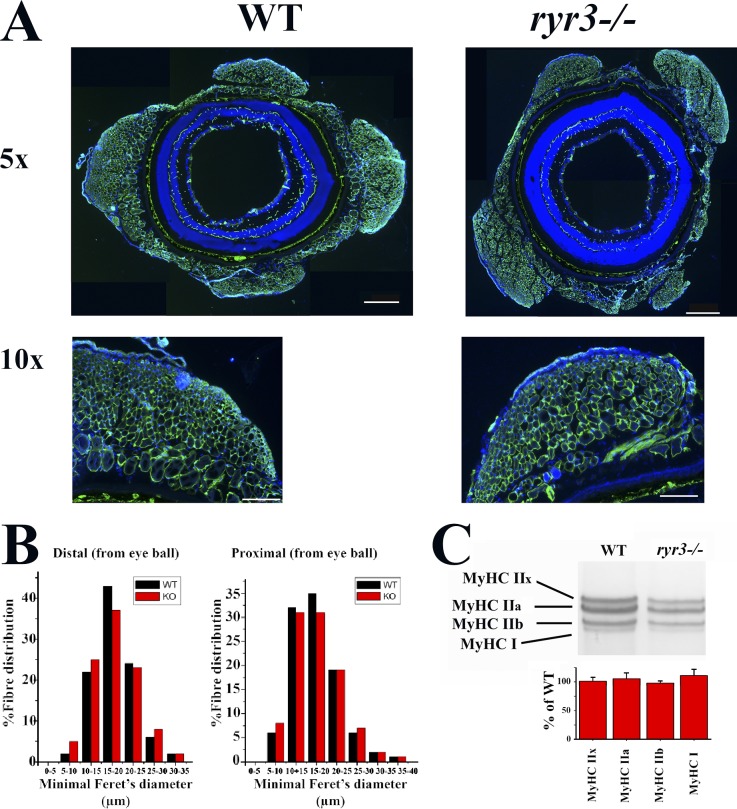
Fiber type distribution and MyHC composition is similar in EOM muscles from WT and ryr3−/− mice. (A) EOM from WT and ryr3−/− mice were sectioned, stained with anti-MyHC recognizing all isoforms and DAPI, and observed by fluorescent microscopy. Scale bars represent 500 µm (5× images) and 200 µm (10× images). (B) The fiber size distribution of EOMs was determined using the minimal Feret’s diameter using MyHC immunohistochemistry (Delbono et al., 2007; black bars, WT; red bars ryr3−/−). (C) High-resolution SDS-PAGE separation of MyHC isoforms in WT and ryr3−/− EOM muscles (Talmadge and Roy, 1993). The bottom bar graphs show the percent specific MyHC isoform vs. total MyHC content in ryr3−/− relative to WT (mean ± SEM, n = 5 WT and n = 5 ryr3−/−), which was set to 100%.

