Figure 7.
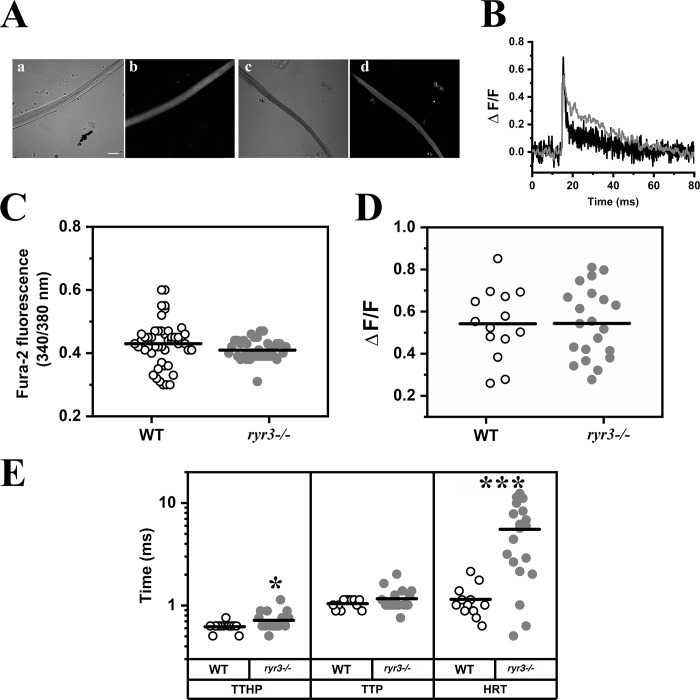
Calcium homeostasis in isolated EOM fibers. (A) Confocal images of WT (a and b) and ryr3−/− (c and d) fibers; a and c show the transmitted light channel, and b and d show Mag-Fluo4 fluorescence, excited at 488 nm and recorded at an emission between 500 and 550 nm. Scale bar, 30 µm. (B) Representative line scan traces of MagFluo4 calcium transients in EOM fibers from WT (black) and ryr3−/− (gray), recorded at 7,921 lines per second. (C) Measurements of resting Ca2+ expressed as ratio (340/380 nm) using the fluorescent indicator fura-2. Each symbol represents the ratio obtained from a single fiber. The horizontal black line shows the mean value. Fibers were isolated from a total of three mice per group, and a total of 49 fibers from WT and 40 fibers from ryr3−/− were analyzed. (D) Peak Ca2+ (ΔF/F) of the MagFluo4 fluorescence obtained by stimulating EOM fibers by electrical field stimulation with a 0.5-ms bipolar pulse. All experiments were performed at room temperature. Each symbol represents the value from a single fiber. The horizontal black line shows the mean value. A total of 14 fibers from four WT mice and 21 fibers from nine ryr3−/− mice were analyzed. (E) Analysis of the kinetics of the Ca2+ transients; TTHP, TTP, and HRT of the calcium transients are plotted. White dots, WT; gray dots, ryr3−/−. A total of 12 fibers from four WT mice and 19 fibers from nine ryr3−/− mice were analyzed. *, P < 0.05; ***, P < 0.001, Student’s t test.

