Figure 8.
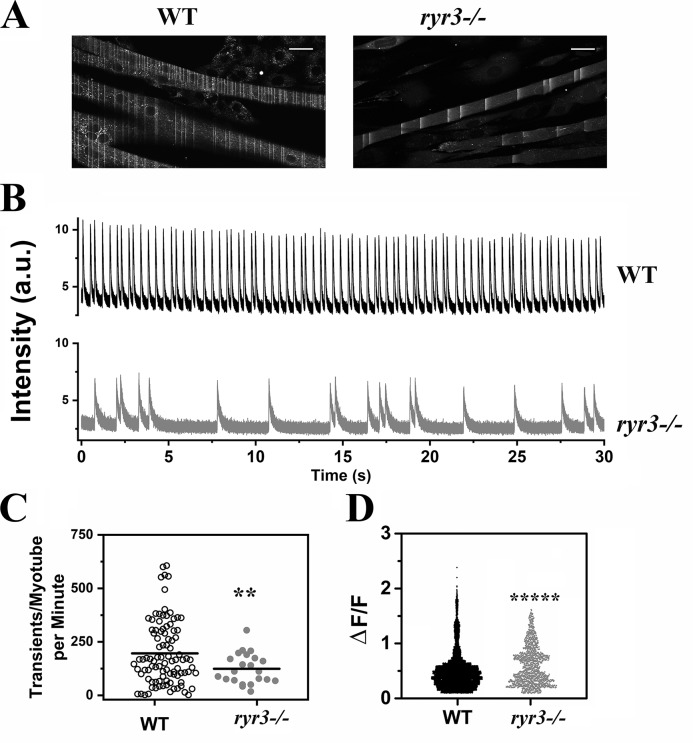
ryr3−/− EOM-derived myotubes show fewer calcium waves than WT EOM-derived myotubes. (A) WT (left) and ryr3−/− (right) confocal image of myotubes loaded with Fluo-4. Spontaneous calcium waves can be seen as lines during image acquisition. Scale bars, 30 µm. (B) Representative Fluo-4 line scan traces of WT (top, black line) and ryr3−/− (bottom, gray line) myotubes. a.u., arbitrary units. (C) Analysis of the frequency of the spontaneous Ca2+ transient. Each point represents the number of transients per minute recorded in a single myotube. Each myotube was recorded for 30 s, and the frequency output is given as frequency per minute. Experiments were performed at room temperature. The horizontal black line represents the mean value. Empty circles, WT (n = 95); gray circles, ryr3−/− (n = 22). (D) ΔF/F of the Fluo-4 transients. The number of transients analyzed was n = 9,319 and n = 1,368 for WT and ryr3−/−, respectively. **, P < 0.005; *****, P < 0.0001, Welch's t test.

