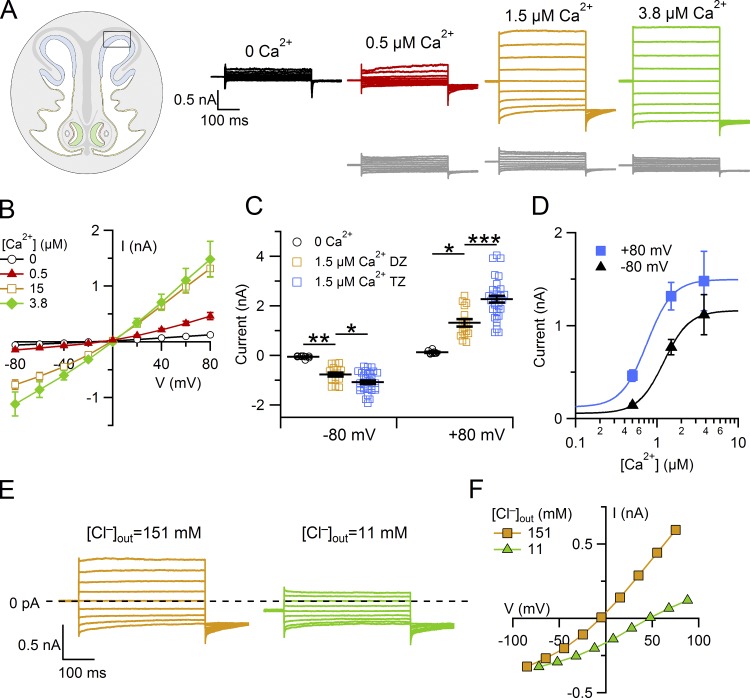
Figure 4.
Ca2+-activated chloride current in supporting cells from the dorsal zone of the olfactory epithelium. (A) Representative whole-cell currents recorded from different supporting cells from the dorsal zone with pipette solutions containing the indicated [Ca2+]. The holding potential was 0 mV, and voltage steps from −80 mV to +80 mV with 20-mV increments, followed by a step to −80 mV, were applied as shown in the top panel of Fig. 3 A. (B) Average ± SEM of steady-state I-V relations in the presence of the following [Ca2+]i: nominally 0 (n = 9), 0.5 µM (n = 9), 1.5 µM (n = 16), and 3.8 µM (n = 4). (C) Scatter dot plot with average ± SEM showing current amplitudes measured at −80 and +80 mV with the indicated [Ca2+]i in the dorsal zone (DZ) or transition zone (TZ). Number of cells indicated in the legends of Fig. 3 B or 4 B for the TZ or DZ, respectively. *, P < 0.05; **, P < 0.01; ***, P < 0.001; Tukey test after one way ANOVA. (D) Comparison of dose–responses at +80 and −80 mV, from the same experiments shown in B, fitted to the Hill equation (Eq. 1). The error bars indicate SEM. (E) Representative whole-cell currents recorded with pipette solution containing 1.5 µM Ca2+. Extracellular ion concentrations were modified by replacing 140 mM NaCl in the Ringer’s solution with sucrose, reducing the extracellular [Cl−] to the indicated concentrations. (F) Current amplitudes measured at the end of voltage pulses versus the test potential from the cell shown in E.

