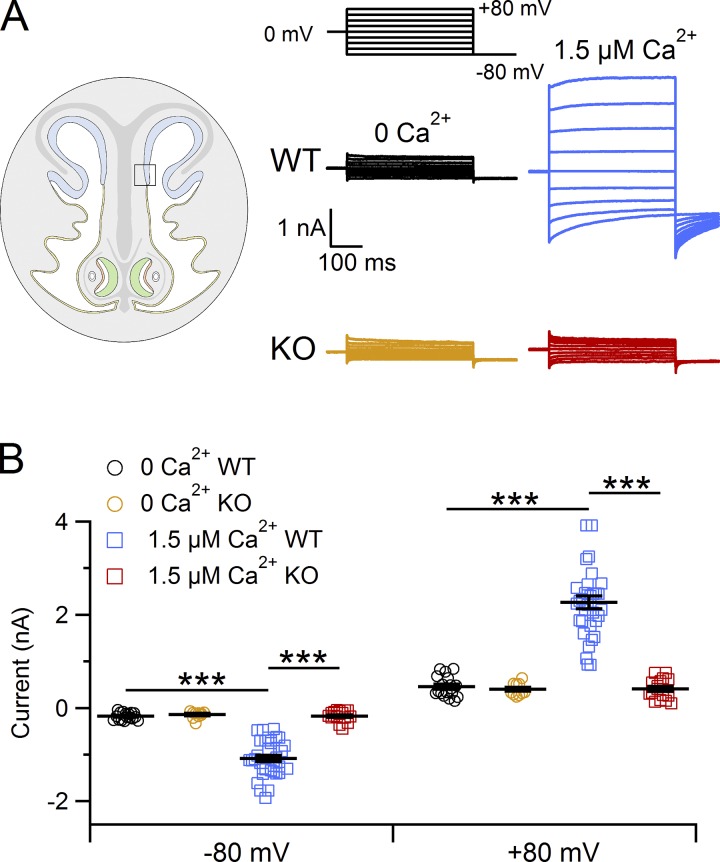
Figure 6.
Lack of Ca2+-activated currents in supporting cells from TMEM16A KO mice. (A) Representative whole-cell recordings obtained with pipette solutions containing 0 or 1.5 µM Ca2+, as indicated. The voltage protocol is reported at the top of the panel. (B) Scatter dot plot with average ± SEM showing current amplitudes measured at −80 and +80 mV in the presence of the following [Ca2+]i: for WT mice nominally 0 (n = 17), 1.5 µM (n = 33) or for TMEM16A KO mice nominally 0 (n = 10), 1.5 µM (n = 16). ***, P < 0.001, Tukey test after one-way ANOVA. Recordings were obtained from supporting cells located close to the transition zone with the respiratory epithelium.

