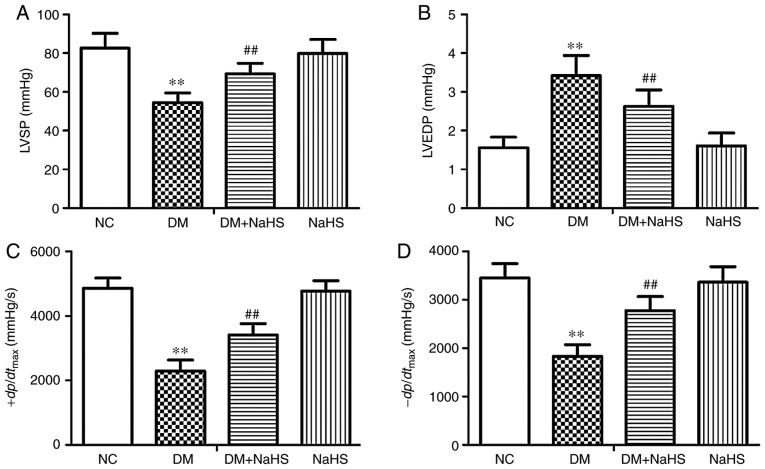
Figure 2.
Effect of exogenous hydrogen sulfide on cardiac function in the different groups. (A) LVSP, (B) LVEDP, (C) +dp/dtmax, (D) -dp/dtmax in the different groups. Data are presented as the mean ± SD. n=8/group. **P<0.01 vs. NC group; ##P<0.01 vs. DM group. LVSP, left ventricular systolic pressure; LVEDP, left ventricular end diastolic pressure; +dp/dtmax, maximal rise rate of left ventricular pressure; −dp/dtmax, maximal fall rate of left ventricular pressure; NC, normal control; DM, diabetes mellitus; NaHS, sodium hydrosulfide.

