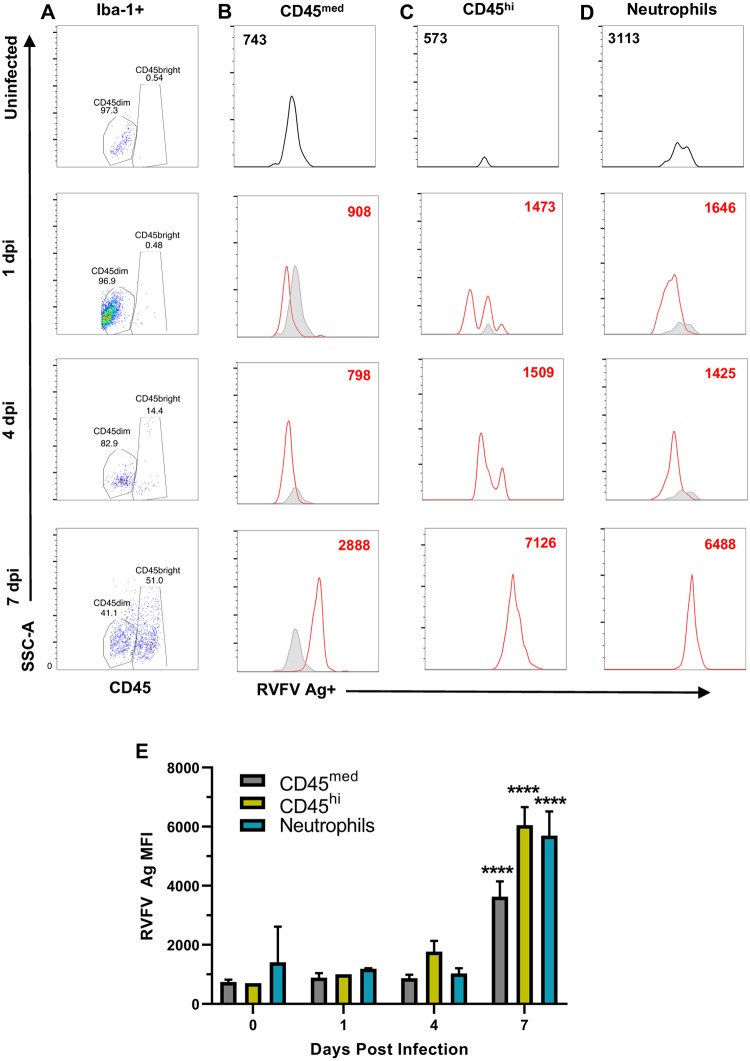
Fig 6. Detection of RVFV-infected cells within rat brains.
Representative flow cytometry plots of brain cells isolated from AERO-infected rats. Live cells were first gated on Iba-1 then assessed for CD45 expression. (A) All Iba-1+ cells showing differential expression of CD45. Viral antigen within (B) CD45med, (C) CD45hi, and (D) neutrophils. Cells isolated from uninfected rat brains (gray) are compared to infected rat brains (red) at the indicated time points. The corresponding MFI of viral antigen staining is indicated by the number within the histogram. (E) Comparison of MFI of RVFV Ag staining within the indicated cell populations (n = 2–4 samples/time point). Statistical significance determined by 2-way ANOVA with multiple comparisons. MFI from all 7 dpi samples were statistically significant compared to 0,1,4 dpi.

