
Figure 1.
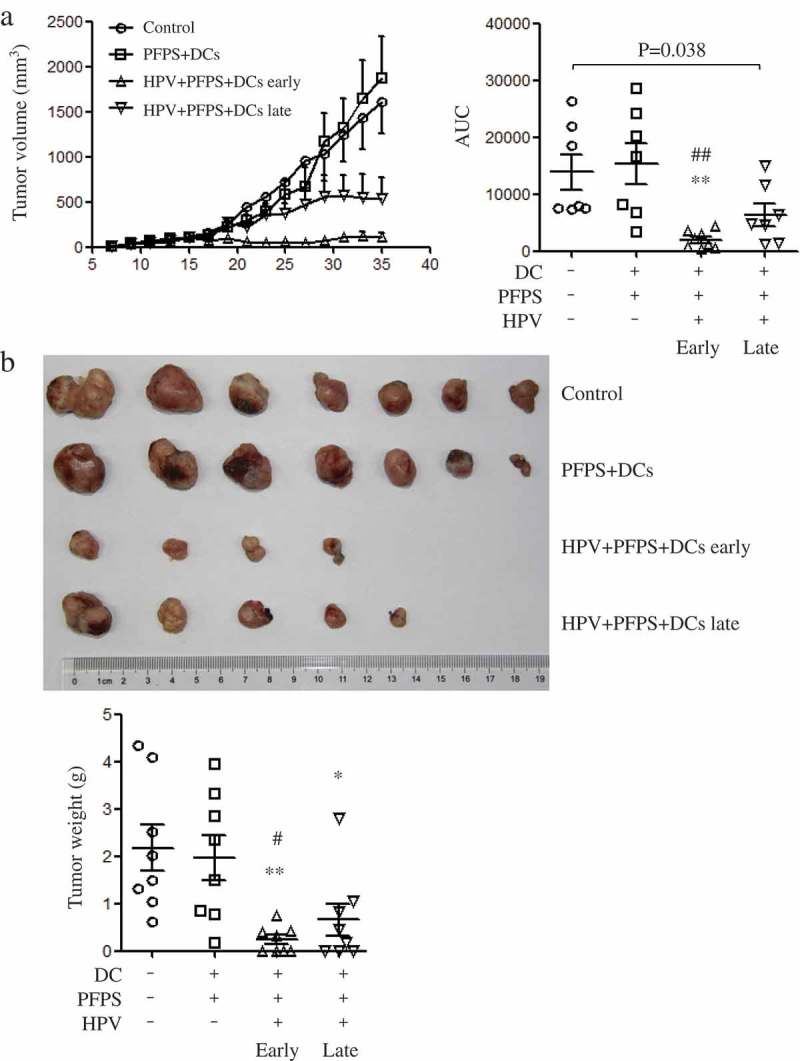
Tumor growth and tumor weight after HPV + PFPS + DCs early and late treatment.
After injection of TC-1 cells, tumor mice were immunized twice on days 5 and 12 in HPV + PFPS + DCs early and PFPS + DCs groups, or on days 12 and 19 in HPV + PFPS + DCs late group. (A) Tumor volumes (mean± SEM) were measured shown in the left panel. The area under curve (AUC) was calculated using Prism 5 and shown in right panel (mean± SEM). P value (Mann-Whitney test) is given. (B) Tumors were isolated and weighted at the end of this experiment. The tumor photo and weight (mean± SEM) are shown in upper and lower panels, respectively. *P < 0.05 and **P < 0.01 (ANOVA) compared to control group. #P < 0.05 and ##P < 0.01 (ANOVA) compared to PFPS + DCs group.