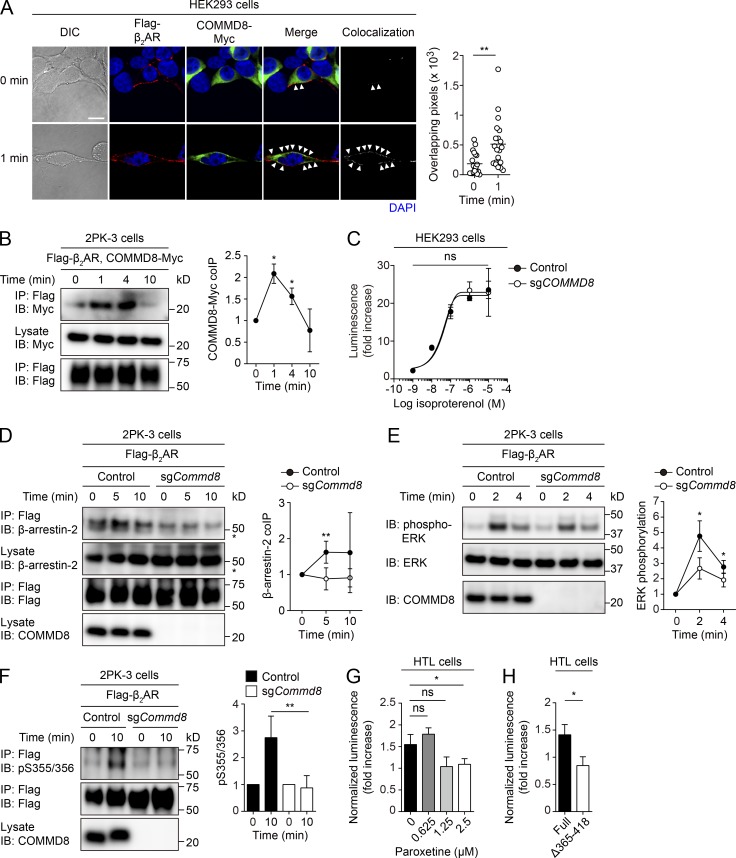
Figure 7.
COMMD8 is involved in β-arrestin-mediated signaling of β2AR. (A) Confocal microscopy for the subcellular localization and colocalization of Flagg-tagged β2AR (red) and Myc-tagged COMMD8 (green) in HEK293 cells before and at 1 min after treatment with pan-βAR agonist isoproterenol. Colocalization of the signals (arrowheads) was quantified as in Fig. 1 C. Each symbol represents an individual cell, and bars indicate means (0 min, n = 20; 1 min, n = 20). Representative images are shown. Bar, 10 µm. (B) IP assay for the interaction of Myc-tagged COMMD8 with Flag-tagged β2AR in 2PK-3 cells after stimulation with selective β2AR agonist clenbuterol. (C) cAMP production assessed by GloSensor in vector-transfected control and COMMD8-deficient (sgCOMMD8) HEK293 cells after stimulation with isoproterenol. The amounts of cAMP are plotted as fold increases of luminescence over the levels in unstimulated cells. Data are shown as the mean ± SD of triplicates and representative of three experiments. (D) IP assay for the recruitment of endogenous β-arrestin-2 to Flag-tagged β2AR in vector-transfected control and COMMD8-deficient (sgCommd8) 2PK-3 cells after stimulation with isoproterenol. Asterisks indicate nonspecific bands. (E) IB analysis for the phosphorylation of ERK in vector-transfected control and sgCommd8 2PK-3 cells after stimulation with isoproterenol. (F) IB analysis for GRK6-mediated phosphorylation (p) at S355/356 of Flag-tagged β2AR in vector-transfected control and sgCommd8 2PK-3 cells after stimulation with isoproterenol. Error bars represent the mean ± SD of three (B), four (E and F), or five (D) independent experiments, and representative blots are shown. (G) Tango assay for the association of COMMD8 with β2AR in the presence of paroxetine. (H) Tango assay for the association of COMMD8 with a C terminus–truncated β2AR mutant lacking GRK2 phosphorylation sites. The luminescence from the tTA-dependent firefly luciferase reporter was normalized to that from the cotransfected Renilla luciferase and plotted as fold increases over the levels in unstimulated cells (G and H). *, P < 0.05; **, P < 0.01; ns, not significant. The P values were obtained by two-tailed unpaired (A and D–H) or paired (B and C) t test. coIP, coimmunoprecipitation; DIC, differential interference contrast.

