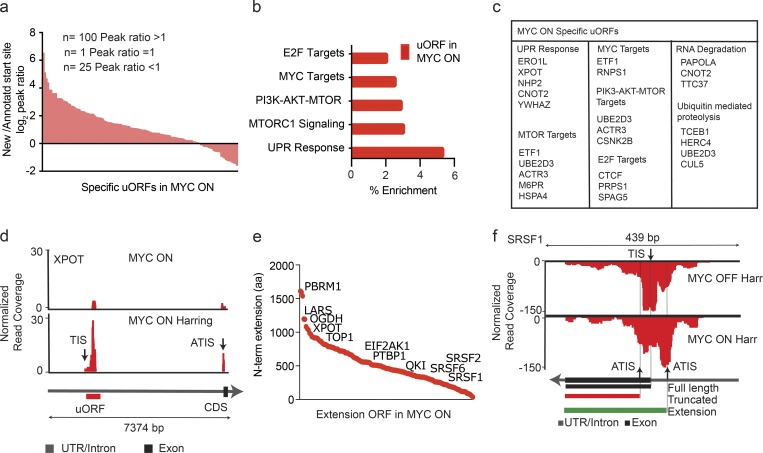
Figure 5.
High-MYC conditions favor upstream translation initiation. (a) The peak height ratio of RF reads across the annotated TIS versus the uORF TIS indicates preferential uORF initiation for most uORF-containing genes in the MYC ON condition. n = 3 biological replicates in each group. (b) GO identifies categories of genes with MYC-activated uORFs. n = 3 biological replicates in each group. (c) List of genes harboring uORFs in the MYC ON state by KEGG category. n = 3 biological replicates in each group. (d) RF distribution with and without harringtonine for XPOT indicates uORF usage in the MYC ON state; black and red arrows indicate the predicted (TIS) and ATIS, respectively. n = 3 biological replicates in each group. (e) MYC-induced 5′ extended ORFs ranked by the number of additional N-terminal amino acids. n = 3 biological replicates in each group. (f) RF read distribution across the SRSF1 transcript in high and low MYC indicates variable ATIS usage. Harr indicates harringtonine arrest. Black arrows indicate predicted TIS and ATIS, respectively. Exons shown as black squares. n = 3 biological replicates in each group.

