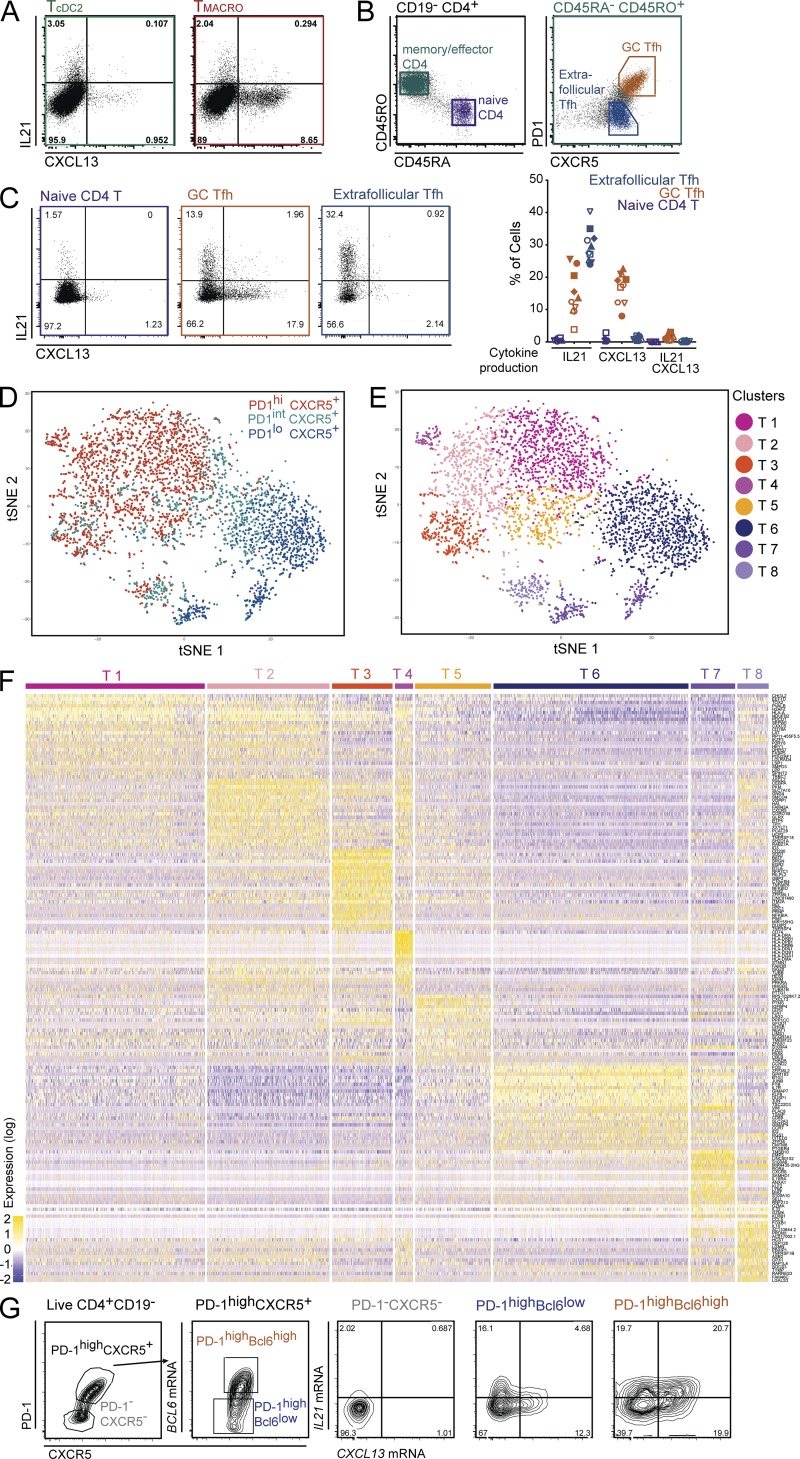
Figure 4.
Human Tfh cells comprise two distinct effectors states characterized by IL-21 or CXCL13 production. (A) Purified tonsil DC subsets and macrophages were co-cultured with allogeneic naive CD4+ T cells. IL-21 and CXCL13 production was analyzed by intracellular staining after restimulation with PMA and ionomycin in presence of brefeldin A. Representative results, gated on live CD4+ CTV− cells (n = 13). T cells polarized with cDC2 or CD14+ macrophages are termed TcDC2 and TMACRO, respectively. (B–G) CD4+ T cells were extracted from tonsils. (B) Gating strategy. Naive CD4+ T cells were CD4+CD45RA+CD45RO−, GC Tfh cells CD4+CD45RO+PD-1highCXCR5+, and extra-follicular Tfh cells CD4+CD45RO+PD-1lowCXCR5+. (C) IL-21 and CXCL13 production was analyzed as in A. Percentage of cells expressing IL-21, CXCL13, or double positive. Each symbol represents an individual donor. Cells were analyzed either directly after enrichment (filled symbols, n = 5) or after cell sorting (open symbols, n = 5). (D–F) Tonsil CD4+CD45RA−CD45RO+ cells were purified as CXCR5+PD-1low, CXCR5+PD-1int, and CXCR5+PD-1high cells and were analyzed by single-cell RNA-seq using a Drop-seq approach. Combined single-cell transcriptomes were analyzed. (D and E) t-SNE representation of cell clusters identified using unsupervised clustering. Each dot represents an individual cell. (D) Colors represent sample origin. (E) Colors represent identified clusters. Clusters are manually ordered. (F) Heatmap of scaled expression (log values of UMI) for the top 25 differentially expressed genes of each cluster (based on log fold change). (G) IL21 and CXCL13 mRNA expression was analyzed in tonsil CD4+CD45RA−CD45RO+ cells by in situ hybridization coupled to flow cytometry. Cells were gated based on Bcl6 and CXCR5 expression. Representative results (n = 4).

