Figure 5.
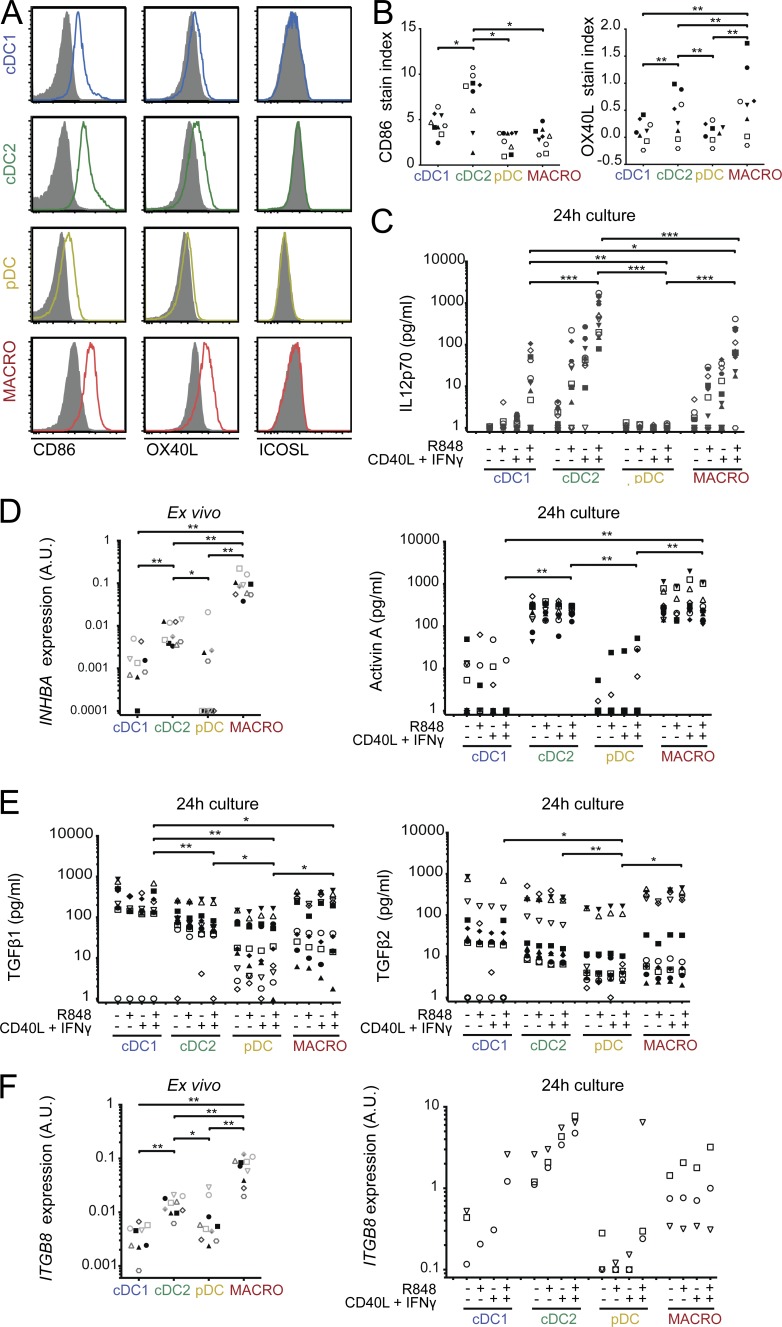
cDC2 and macrophages are the best producers of Tfh cell–polarizing signals. (A and B) Tonsil DCs and macrophages were stained ex vivo for CD86, OX40L, and ICOSL. (A) Representative results. Filled gray histograms represent isotype control staining. (B) Stain index quantification for CD86 and OX40L. Each symbol represents an individual donor (n = 9 for CD86, n = 8 for OX40L). (C–F) Purified DC and macrophages were analyzed ex vivo or after 24 h culture with or without R848, CD40L, and IFN-γ. Cytokine secretion was analyzed by CBA (IL12p70) or ELISA (activin A and TGFβ), and mRNA expression by RT-qPCR. (C) n = 12 for IL12p70. (D) n = 10 for INHBA expression and for activin A. (E) n = 10 for TGFβ. (F) n = 10 for ITGB8 expression ex vivo, n = 3 after 24 h culture except for cDC1 (n = 1–3). Each symbol represents an individual donor. A.U., arbitrary units. *, P < 0.05; **, P < 0.01; ***, P < 0.001; Wilcoxon test.

