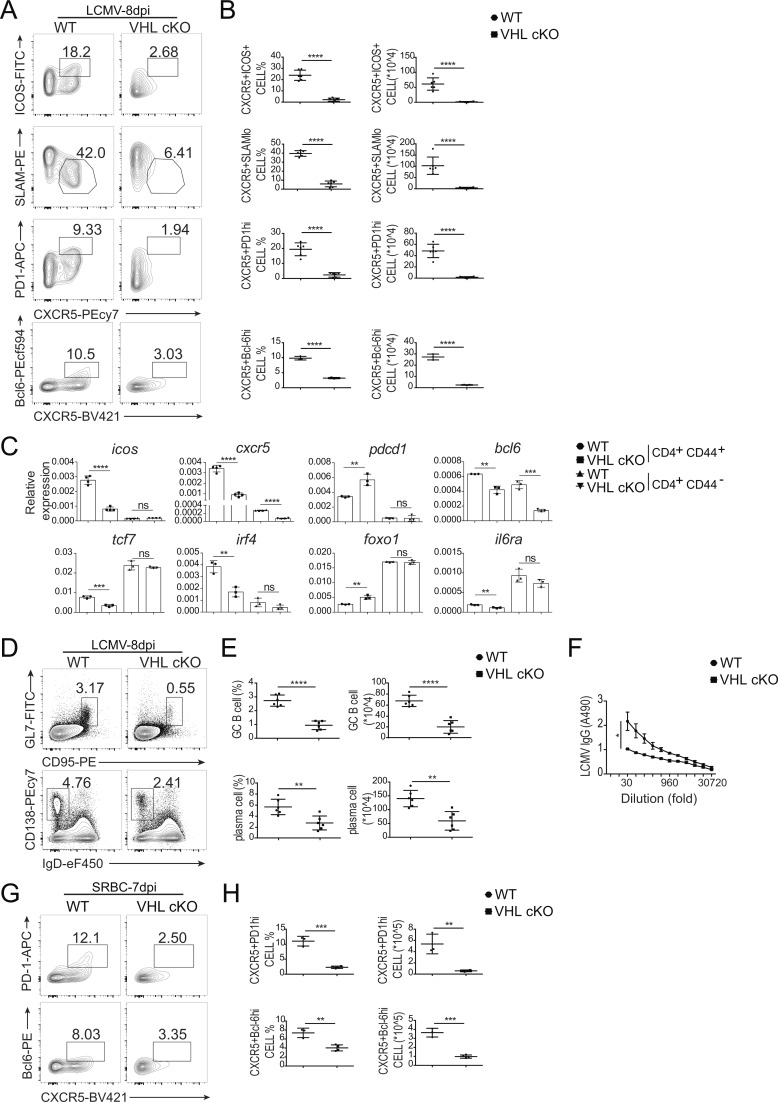
Figure 1.
VHL deficiency results in defective Tfh cell development and function. (A) Representative flow-cytometric plots of activated CD44+CD4+ T cells from WT and CD4CreVhlfl/fl (VHL cKO) mice 8 d after infection with LCMV. Numbers adjacent to outlined areas indicate frequency of Tfh (CXCR5+ICOS+ or CXCR5+SLAMlo) cells or GC-Tfh (CXCR5+PD-1hi or CXCR5+Bcl-6hi) cells. (B) Quantification of frequency (among CD44+CD4+ T cells) and number of Tfh cells and GC-Tfh cells of mice as in A (n = 6 per group). (C) RT-PCR analysis of mRNA of Tfh cell–related genes in CD44+CD4+ and CD44−CD4+ T cells from WT and VHL cKO mice 8 d after LCMV infection; results were normalized to those of Actb mRNA (encoding β-actin). (D) Representative flow-cytometric plots of total B220+ B cells from WT and VHL cKO mice 8 d after LCMV infection. Numbers adjacent to outlined areas indicate frequency of GC B (GL7+CD95+; top row) or plasma (CD138+IgDlo; bottom row) cells in the spleen. (E) Quantification of frequency (among B220+ B cells) and number of GC B and plasma cells in the spleen of mice as in D (n = 6 per group). (F) ELISA of LCMV-specific IgG in the sera from infected mice as in D (n = 6 per group), presented as absorbance at 490 nm (A490). (G) Representative flow-cytometric plots of CD44+CD4+ T cells from WT and VHL cKO mice 7 d after immunization with SRBC. Numbers adjacent to outlined areas indicate frequency of GC-Tfh (CXCR5+PD-1hi or CXCR5+Bcl-6hi) cells. (H) Quantification of frequency (among CD44+CD4+ T cells) and number of GC-Tfh cells of mice as in G (n = 3–4 per group). Each symbol (B, E, and H) represents an individual mouse; small horizontal lines indicate the mean (± SD). *, P < 0.05; **, P < 0.01; ***, P < 0.001; ****, P < 0.0001; ns, nonsignificant (Student’s t test). Data are representative of three independent experiments.

