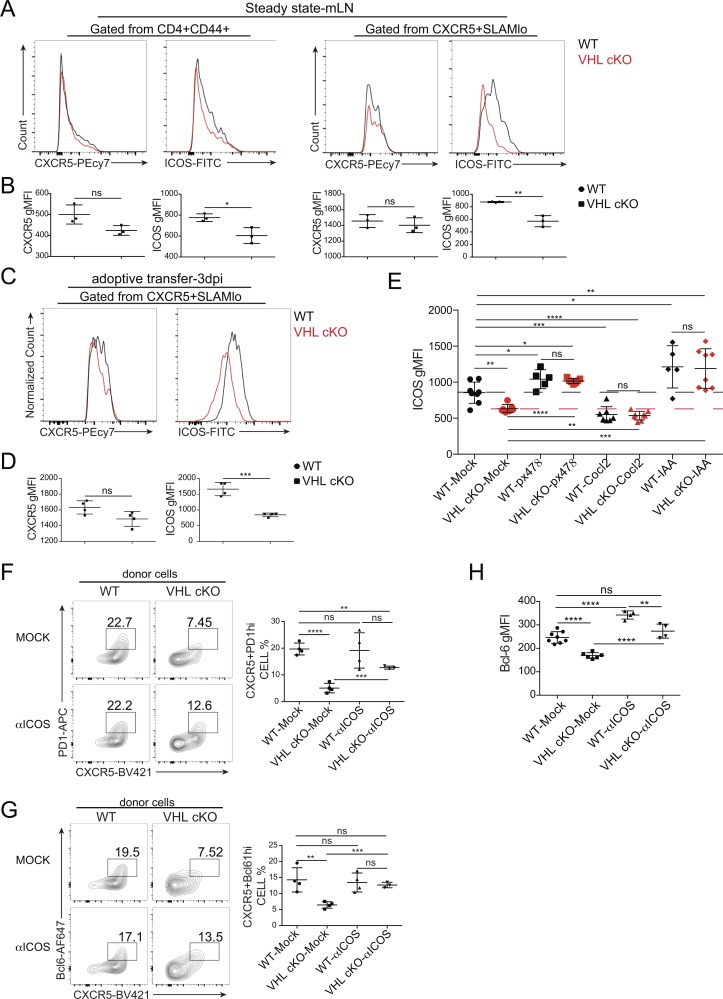
Figure 6.
ICOS is the main target of VHL–HIF-1α–GAPDH pathway during Tfh cell differentiation. (A) Representative flow-cytometric analysis of CXCR5 or ICOS expression in the indicated cell populations in the mLN of WT and VHL cKO mice under steady state. (B) Quantification of CXCR5 or ICOS MFI in the cell population as indicated in A. (C) Representative flow-cytometric analysis of CXCR5 or ICOS expression in the indicated cell population of donor CD45.2+CD4+ T cells obtained from WT CD45.1+ host mice receiving naive CD4+ T cells from WT and VHL cKO SMARTA mice, followed by infection with LCMV and analysis 3 d after infection (dpi). (D) Quantification of CXCR5 or ICOS MFI in the cell population as indicated in C. (E) Quantification of ICOS MFI in WT or VHL cKO Tfh-like cells cultured in the absence or presence of px478, CoCl2, or 2.5 µM IAA. (F and G) Representative flow-cytometric plots of donor CD45.1+CD4+ T cells (left) and quantification of frequency (among CD45.1+CD4+ T cells) of GC-Tfh cells (right) obtained from B6 host mice receiving WT or VHL cKO OT-II CD4+ T cells cultured in the absence or presence of anti-ICOS (C398.4A), followed by immunization with OVA protein and analysis 7 d after immunization. Numbers adjacent to outlined areas indicate frequency of CXCR5+PD-1hi GC-Tfh cells (F) and CXCR5+Bcl6hi GC-Tfh cells (G; n = 3 or 4 per group). (H) Quantification of Bcl-6 MFI in WT or VHL cKO Tfh-like cells cultured in the absence or presence of anti-ICOS. Each symbol (B, D, F, and G) represents an individual mouse; small horizontal lines indicate the mean (± SD). *, P < 0.05; **, P < 0.01; ***, P < 0.001; ****, P < 0.0001; ns, nonsignificant (Student’s t test). Data are representative of three independent experiments.

