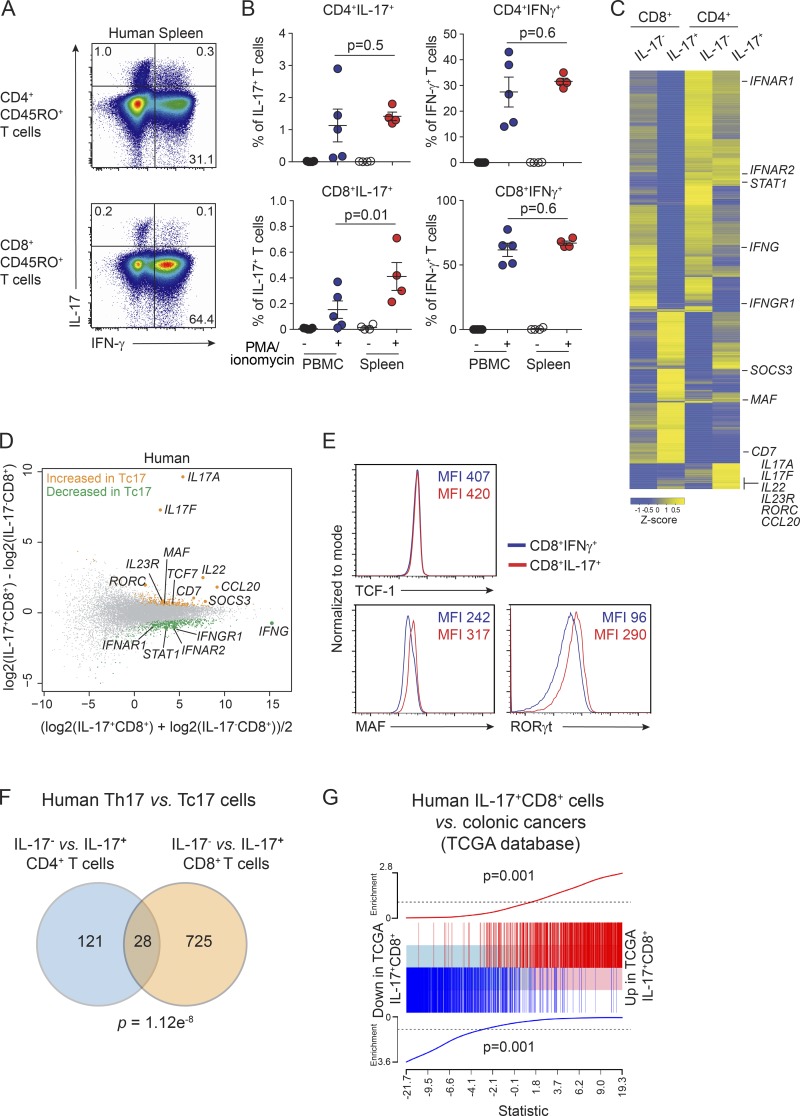
Figure 5.
Tc17 cells occur in healthy humans and express MAF and RORC. (A) Representative dot plot analysis from four individual donors of IL-17 and IFN-γ production by T cells from human spleen. Cells are gated on CD45RO+CD4+ T cells (CD3+CD4+CD8−Vα7.2−TCRγδ−CD45RO+) or CD45RO+CD8+ T cells (CD3+CD4−CD8+Vα7.2−TCRγδ−CD45RO+). (B) Total cell numbers of IL-17 or IFN-γ–producing CD45RO+CD4+ T cells (upper panel) or CD45RO+CD8+ T cells (lower panel) from peripheral blood mononuclear cells (n = 5 donors) and spleen cells (n = 4 donors) from healthy donors determined by intracellular flow cytometry staining following stimulation with PMA and ionomycin for 4 h. Cells are gated as in A. Results are pooled from four independent experiments. Individual responses are shown together with the mean ± SEM; exact P values were calculated using Student’s t test. (C) Heat map displaying DE genes. Yellow color represents high expression, and blue represents low expression in effector IL-17−CD8+ versus IL-17+CD8+ T cells and IL-17−CD4+ versus IL-17+CD4+ T cells. Cells were sorted from spleens of three healthy donors for RNA-seq using a human IL-17 cytokine capture kit following restimulation with PMA and ionomycin. IL-17+CD8+ T cells (CD3+CD4−CD8+Vα7.2−TCRγδ−IL-17+), IL-17−CD8+ effector T cells (CD3+CD4−CD8+Vα7.2−TCRγδ−IL-17−), IL-17+CD4+ (CD3+CD4+CD8−Vα7.2−TCRγδ−IL-17+), and IL-17−CD4+ cells (CD3+CD4+CD8−Vα7.2−TCRγδ−IL-17−). (D) Mean difference plot highlighting genes significantly increased in human spleen IL-17+CD8+ T cells (yellow) versus genes increased in human spleen IL-17−CD8+ T cells (green). Data show log2-fold change compared with mean expression. (E) Protein expression of TCF-1, MAF and RORγt as assessed by flow cytometry from spleen cells of healthy donors. Cells are gated on CD3+CD4−CD8+Vα7.2−TCRγδ−IFN-γ+ (blue) or CD3+CD4−CD8+Vα7.2−TCRγδ−IL-17+ (red). Data show representative histograms from two independent experiments and MFI. (F) Comparison of RNA-seq analyses of human IL-17−CD4+ versus IL-17+CD4+ with IL-17−CD8+ versus IL-17+CD8+ T cells. (G) Enrichment of up-regulated (Up signature) and down-regulated (Down signature) genes in human splenic IL-17+CD8+ cells in the colonic cancers identified from the TCGA database (Up signature P value = 0.001; Down signature P value = 0.001).

