Figure 6.
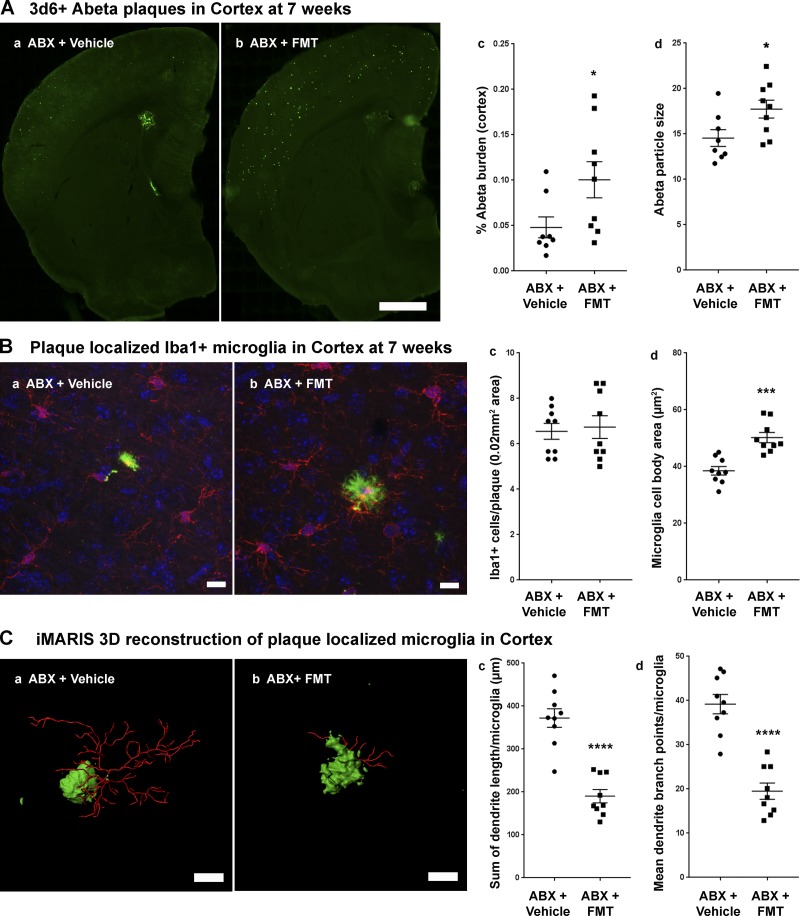
FMT from APPPS1-21 male mice to ABX-treated APPPS1-21 male mice resulted in restoration of Aβ pathology and microglial phenotypes. (A) Representative images of Aβ plaque burden in the cortex of vehicle- (a) and FMT-treated ABX-treated mice (b) using 3D6 antibody. (c) Quantification of plaque burden in vehicle- and FMT-treated ABX-treated male mice. Aβ burden was significantly higher in ABX+FMT–treated mice compared with ABX+vehicle–treated mice (two-tailed Student’s t test: t[15] = 2.209, P = 0.0431). (d) Aβ particle size was also significantly higher in ABX+FMT–treated mice compared with ABX+vehicle–treated mice (two-tailed Student’s t test: t[15] = 2.355, P = 0.0326). (B) Representative images of Iba1-positive microglial cells (a and b). (c) Cell count analysis showed no significant differences between ABX+vehicle–treated mice (a) versus ABX+FMT–treated mice (b; unpaired Student’s t test: t[16] = 0.3026, P = 0.7661). However, FMT resulted in larger cell bodies compared with vehicle-treated ABX-treated male mice (d; unpaired Student’s t test: t[16] = 4.968, P = 0.0001). (C) Imaris 3D reconstruction showed significantly different microglial characteristics between vehicle-treated (a) and FMT-treated (b) ABX-treated male mice. Branch length/microglia (c) showed significantly lower branch length in ABX+FMT–treated mice (unpaired Student’s t test: t[16] = 6.823, P < 0.0001). Moreover, ABX+FMT–treated mice showed significantly lower numbers of branch points per plaque-localized microglia (d; unpaired Student’s t test: t[16] = 6.876, P < 0.0001). Scale bars in A (a and b), B (a and b), and C (a and b) represent 1,000 µm, 10 µm, and 10 µm, respectively. Data are mean ± SEM. *, P < 0.05; ***, P < 0.001; ****, P < 0.0001. n = 8–9/group.

