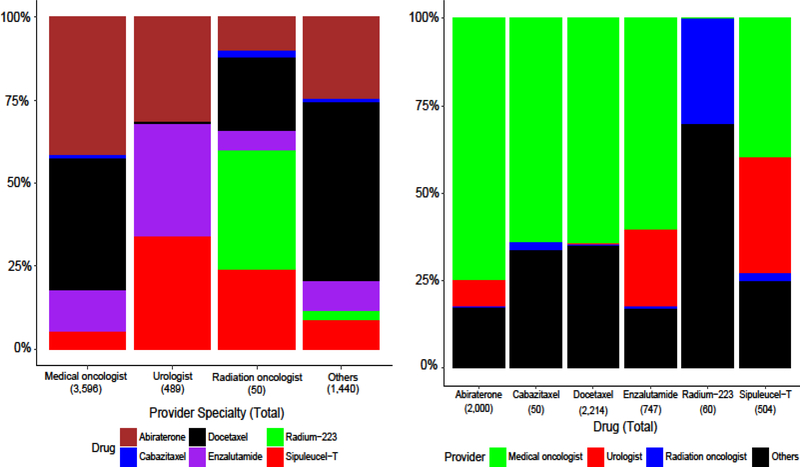
Figure 2. Provider Type and First-Line Treatment.
The top panel shows the proportions of first-line treatments prescribed by different provider specialties and the bottom panel shows the proportions of providers that prescribe the different studied treatments. These proportions include all patients started on a treatment between January 2010 and June 2016. “Others” includes other providers such as advanced practice providers, primary care providers, pharmacies, facilities such as hospitals, and other taxonomies for which we could not confirm that the provider was a medical oncologist, urologist, or radiation oncologist. Details for the classification of providers are in Sections 2.3–2.4 of the Supplementary Materials.

