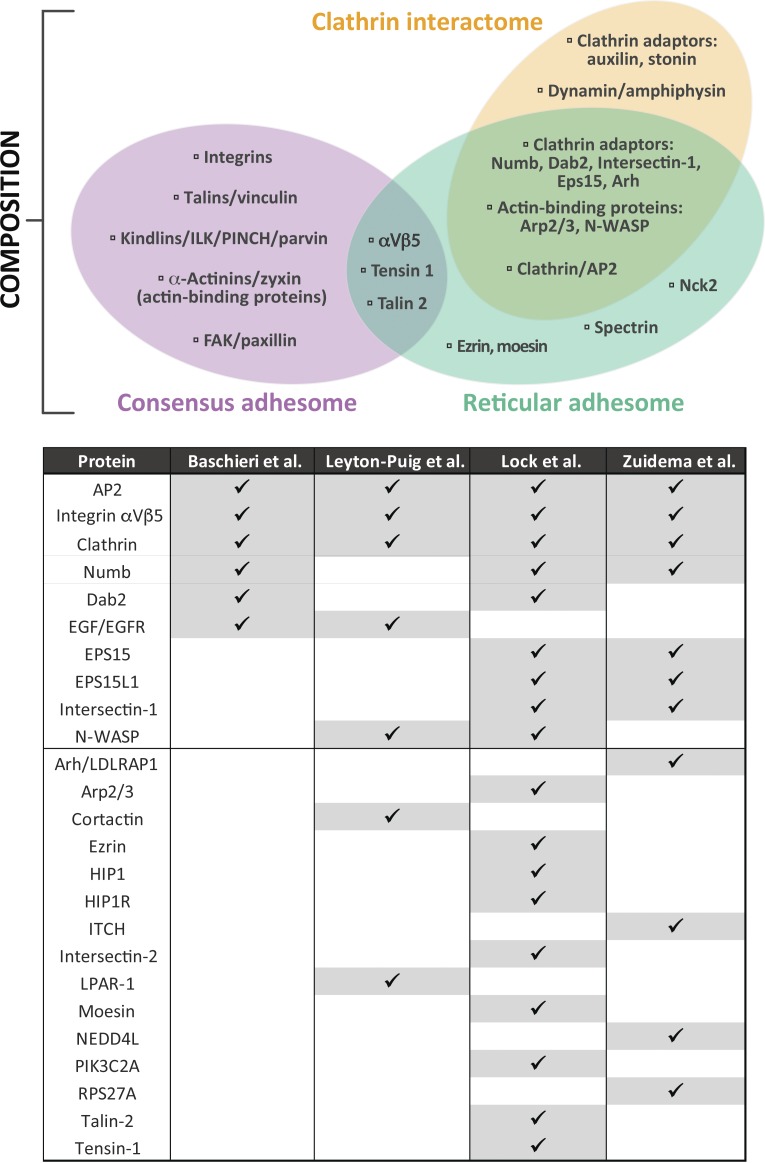
Figure 1.
Comparison of molecular composition. The three-way Venn diagram illustrates a compositional comparison between the consensus (Horton et al., 2015), reticular (Lock et al., 2018), and clathrin interactomes (Schmid and McMahon, 2007). Proteins were chosen and grouped to illustrate typical functional modules, and the selection is not intended to indicate an exhaustive set of components. This analysis shows the limited overlap between canonical AC composition and the RA/clathrin interactomes. However, considerably more overlap is evident between the RA and clathrin interactomes. The table represents a direct comparison between clathrin plaque and RA datasets from the four indicated studies from proteomic and antibody-based localization data (Leyton-Puig et al., 2017; Baschieri et al., 2018; Lock et al., 2018; Zuidema et al., 2018). Proteins were ordered according to the number of datasets in which they were detected. These analyses indicate that while canonical ACs are distinct from RAs and conventional clathrin structures, RAs and plaques are highly compositionally similar and are likely the same.

