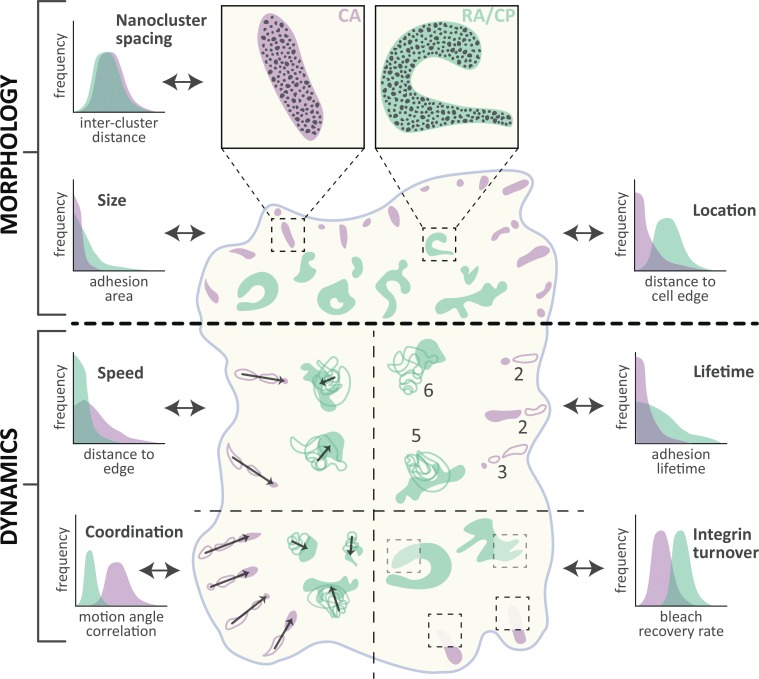
Figure 3.
Comparison of morphology and dynamics. Schematized view of a cell containing canonical ACs (CA; purple) and RAs/plaques (RA/CP; green). Specific morphological (above thick dotted line) and dynamic (below thick dotted line) properties are compared both visually and with illustrative graphs indicating quantitative differences measured in referenced publications. Morphology: Integrin αVβ5 nanoclusters are similar in appearance and arrangement (Nanocluster spacing) in CA and RA/CP (Lock et al., 2018). Visibly more convoluted in shape, RA/CP also achieve larger areas (Size) and are commonly located further from the cell edge (Location) than CA (Lock et al., 2018). Dynamics: CA slide rapidly (Speed; Ballestrem et al., 2001; Lock et al., 2018), linearly, and in a locally anisotropic fashion (Coordination) due to F-actin–derived forces (Besser and Safran, 2006). In contrast, RA/CP grow isotropically and show little directionality (Lock et al., 2018). Dynamics of individual complexes depicted with increasing opacity over time; arrows indicate net motion direction and distance. RA/CP complexes as a whole are highly stable (Lifetime) relative to CA (Lock et al., 2018; numbers indicate total time points observed per structure depicted in schematic). Conversely, the association of integrin αVβ5 proteins (Integrin turnover) with RA/CP is more dynamic than in CA, as revealed by higher recovery rates after photobleaching (Lock et al., 2018; transparency level within dotted boxed depicts relative fluorescence recovery).

