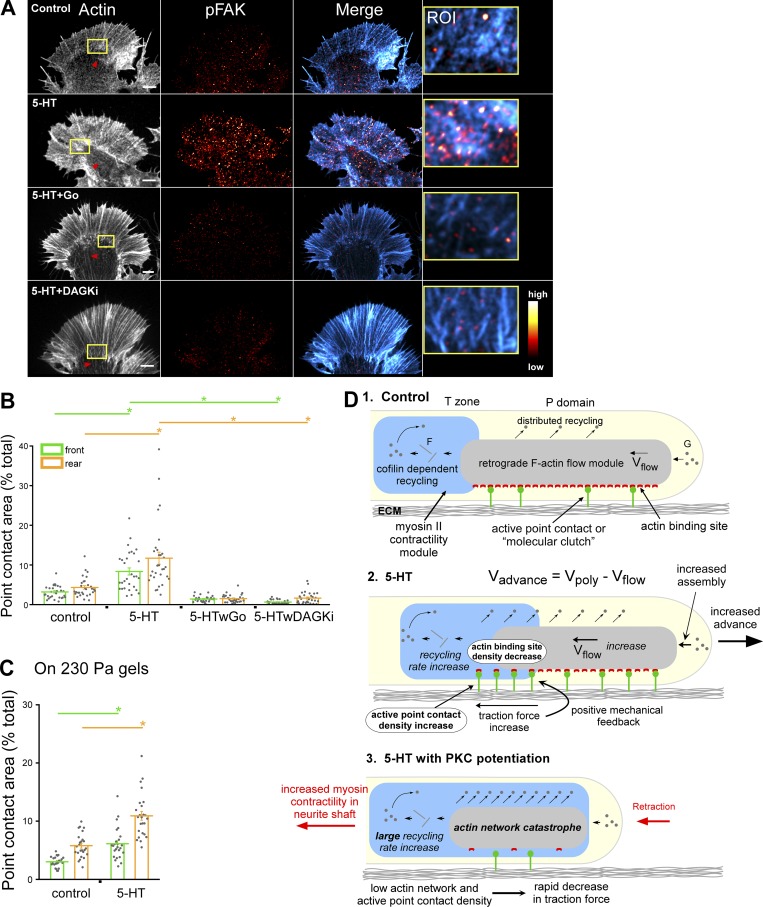
Figure 10.
5-HT–evoked increases in active point contact density are PKC dependent. (A) F-Actin (left), pFAK (middle), overlay of F-actin and pFAK (right), and high-magnification overlays of ROI (yellow box) in actin panel. Red arrowheads, contractile central actin bundle system. Row 1, control; row 2, 5-HT (10 µM, 30 min); row 3, 5-HT with PKC inhibition (Go 5 µM, 15-min pretreatment followed by 10 µM 5-HT in the continued presence of Go for 30 min); row 4, 5-HT with PKC potentiation (DAGKi 5 µM, 15-min pretreatment followed by 10 µM 5-HT in the continued presence of DAGKi for 30 min). F-Actin labeled with phalloidin. Immunolabeling performed with anti-FAK pY397 antibody after normal fixation. pFAK levels encoded in a linear pseudocolor lookup table (color bar). Scale bars, 5 µm. (B) Point contact quantification under conditions in A. Region demarcations are illustrated in Fig. S2 A. Data are mean areas (% of total) ± SEM. For each condition, 30 growth cones pooled from three independent experiments were measured. P = 1.31 × 10⁻²¹ (front) and P = 3.36 × 10⁻¹⁶ (rear) with single-factor ANOVA. *, Significant difference using Tukey’s HSD post hoc analysis. (C) Quantification of point contact areas in control versus 5-HT (10 µM, 30 min) on soft PA gels (230 Pa); see Fig. S4 K for the corresponding F-actin and pFAK images. Region demarcations are illustrated in Fig. S2 A. Data are mean (% total) ± SEM. For each condition, 25 growth cones pooled from three independent experiments were measured. *, P < 0.0001 with two-tailed unpaired t test. (D) Graphical summary: see related text in Discussion.

