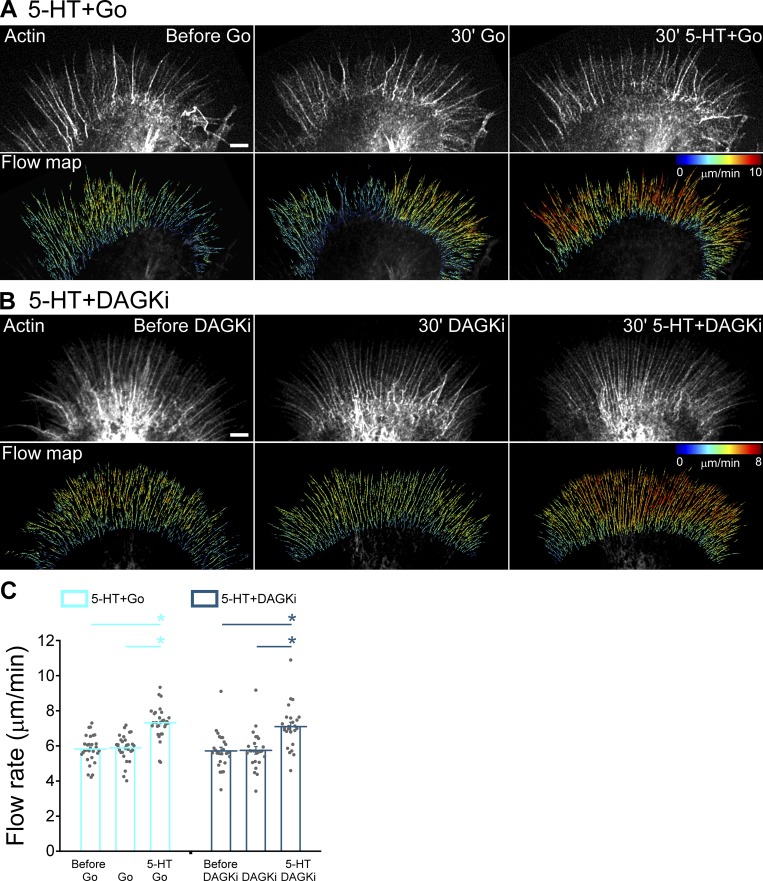
Figure 2.
Modulation of PKC action does not affect 5-HT–induced increase in retrograde F-actin flow rates. (A and B) Alexa Fluor 594–phalloidin FSM (top) and corresponding flow vector map (bottom) of growth cones showing 5-HT–induced increase in F-actin flow under various conditions. (A) Left: Control. Middle: PKC inhibition with Go (5 µM, 30 min). Right: 5-HT+Go (10 µM in continued presence of Go for 30 min). (B) Left: Control. Middle: PKC potentiation with DAGKi (5 µM, 30 min). Right: 5-HT+DAGKi (10 µM in continued presence of DAGKi for 30 min). Images acquired every 5 s for 2 min to generate vector maps. Vector map colors encode speed (see scale bars), zoom in to view vector details. Scale bars, 5 µm. (C) Summary of P-domain retrograde flow rates in response to 5-HT in Go or DAGKi backgrounds: Go (5 µM, 20–40 min); 5-HT+Go (10 µM, 20–40 min, in the continued presence of Go); DAGKi (5 µM, 20–40 min); 5-HT+DAGKi (10 µM, 20–40 min, in the continued presence of DAGKi). Data are mean (μm/min) ± SEM. Number of growth cones evaluated: 29 for 5-HT+Go and 25 for 5-HT+DAGKi, each pooled from four independent experiments. *, P < 0.001 with two-tailed paired t test.

