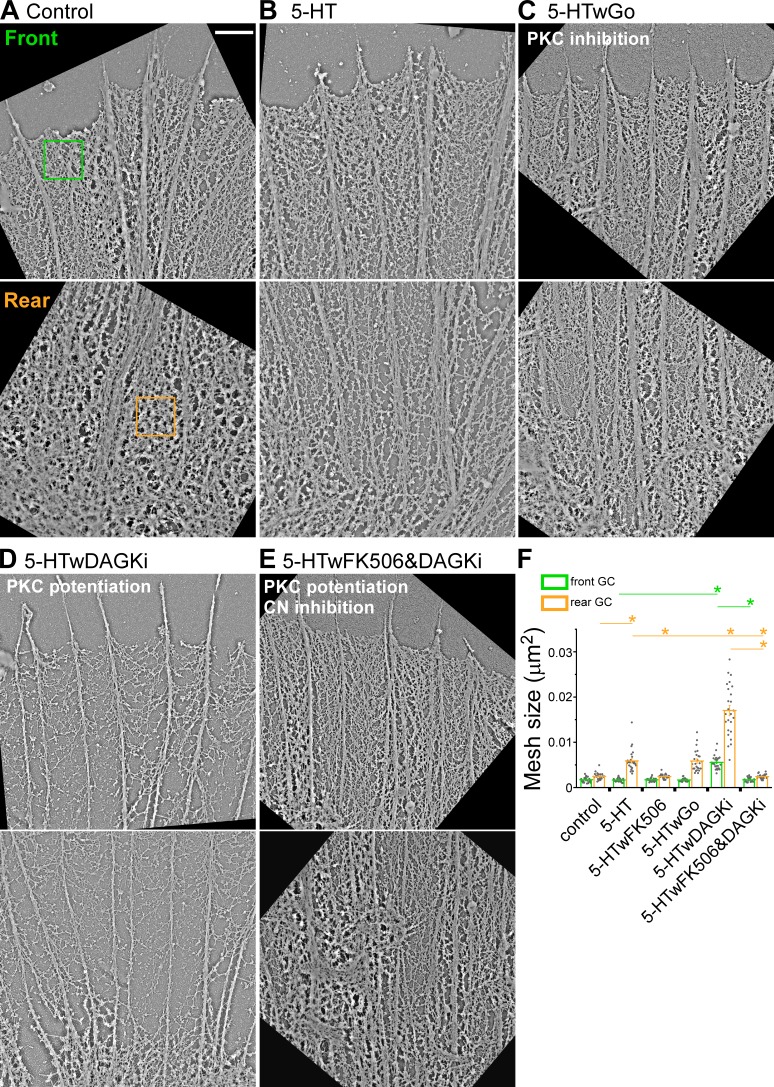
Figure 3.
Potentiation of PKC action promotes cofilin-dependent thinning of actin networks during 5-HT responses. Platinum replica transmission electron micrographs illustrating typical actin network ultrastructure in front and rear growth cone domains. (A) Control conditions. (B) 5-HT (10 µM, 30 min). (C) PKC inhibition: 5-HT+Go (Go 5 µM, 15-min pretreatment followed by 10 µM 5-HT for 30 min, in the continued presence of Go). (D) PKC potentiation: 5-HT+DAGKi (DAGKi 5 µM, 15-min pretreatment followed by 10 µM 5-HT for 30 min, in the continued presence of DAGKi). (E) CN→cofilin inhibition: 5-HT+FK-506+DAGKi (2.5 µM FK-506 and 5 µM DAGKi, 15-min pretreatment followed by 10 µM 5-HT for 30 min, in continued presence of FK-506 and DAGKi). 1× 1-µm2 regions similar to green and orange boxes were sampled for actin veil morphometry. Scale bar, 1 µm. See Fig. S3 (A–E) for comparative whole growth cone micrographs. (F) Quantification of actin veil mesh size (μm2) under conditions A–E and 5-HT+FK-506 (compare Fig. S3 F). Data are mean (μm2) ± SEM. For each condition, 25 regions from the front and the rear of five growth cones were measured. Experiments were repeated three times. P = 1.96 × 10−49 (front) and P = 8.12 × 10−47 (rear) with single-factor ANOVA. *, Significant difference using Tukey’s HSD post hoc analysis.

