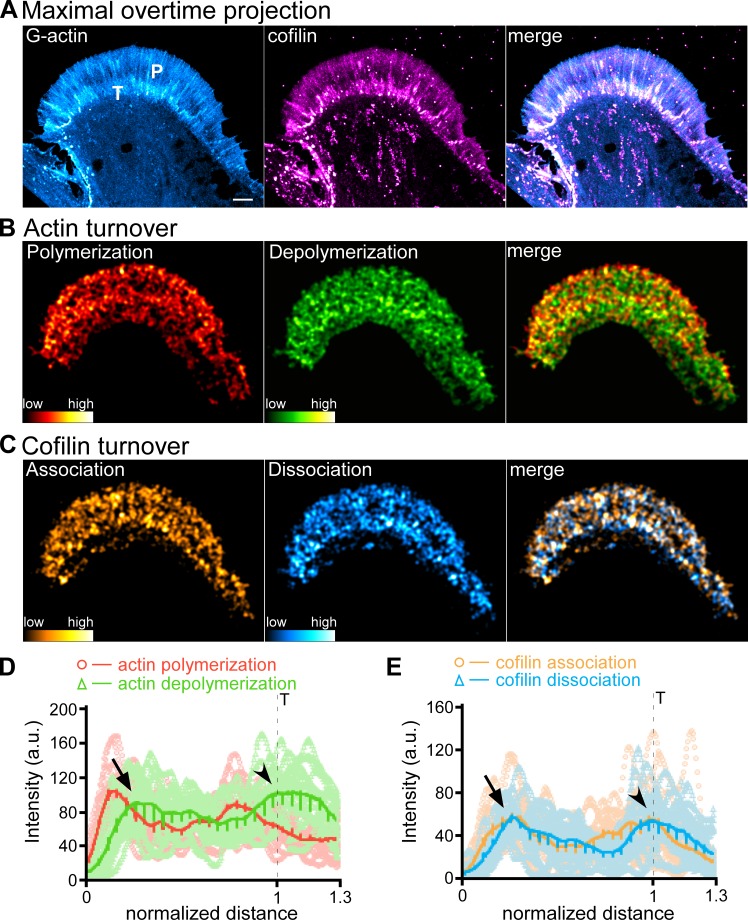
Figure 4.
qFSM evaluation of actin turnover and cofilin dynamics. (A) Maximal overtime projections of G-actin (left), cofilin (middle) speckles, and overlay of G-actin and cofilin (merge, right); see also Video 2. P, P domain; T, T zone. (B) Actin turnover: polymerization (left), depolymerization (middle), and overlay of polymerization and depolymerization (right). (C) Cofilin dynamics: association (left), dissociation (middle), and overlay of association and dissociation (right). Alexa Fluor 488–G-actin and Alexa Fluor 568–cofilin were injected into cells sequentially. Actin (B) and cofilin (C) turnover maps were generated by integration of speckle appearance and disappearance events over 225-s sampling periods with images acquired every 5 s. Relative actin polymerization/depolymerization and cofilin association/dissociation frequencies indicated by color bars. Scale bar, 5 µm. (D and E) Line scans of actin polymerization (red)/depolymerization (green) events (D) and cofilin association (orange)/dissociation (cyan) events (E). Dashed lines indicates T zone. Line scans (width = 30 pixels, length = 1.3× the P domain) were sampled from the front to the rear of the growth cone. Five to seven line scans were performed depending on the size of the growth cone. Raw data are shown in lighter colors. Solid lines are the population average. Number of growth cones measured: three, pooled from three independent experiments. 19 measurements were performed. Arrowhead, T zone; arrow, peaks of actin filament depolymerization and cofilin association near the leading edge.

