Figure 5.
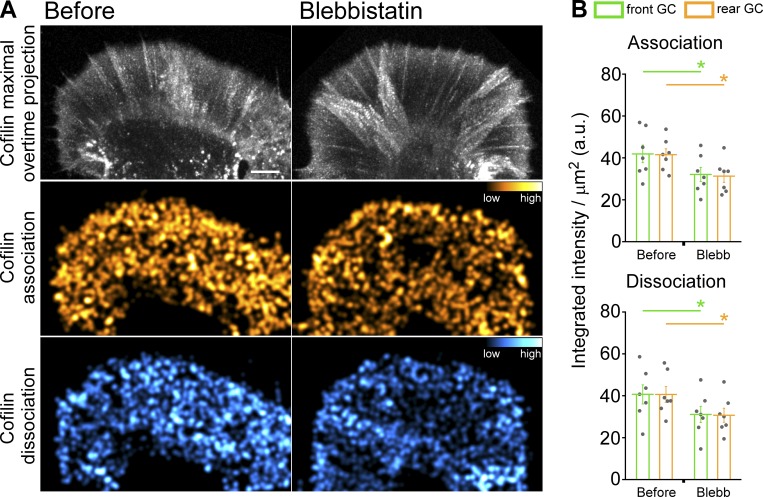
Myosin II inhibition decreases cofilin dynamics. (A) Cofilin dynamics: maximal overtime projection of cofilin speckles (top), cofilin association (middle), and cofilin dissociation (bottom) before (left) and during (right) blebbistatin treatment (66.6 µM, 40 min). Alexa Fluor 568–cofilin was injected into cells; cofilin association and dissociation summation maps generated from 150-s sampling periods with 5-s image acquisition intervals. Colors indicate relative cofilin association/dissociation rates (compare color bars). Scale bar, 5 µm. See also Video 3. (B) Quantification of cofilin association (top) and dissociation (bottom) in front and rear growth cone regions: blebbistatin (66.6 µM, 30–50 min) treatment decreases cofilin dynamics. Region demarcation protocol as in Fig. S2 A. Data are mean (a.u.) ± SEM. Number of growth cones evaluated: seven, pooled from three independent experiments. *, P < 0.001 with two-tailed paired t test.

