Figure 8.
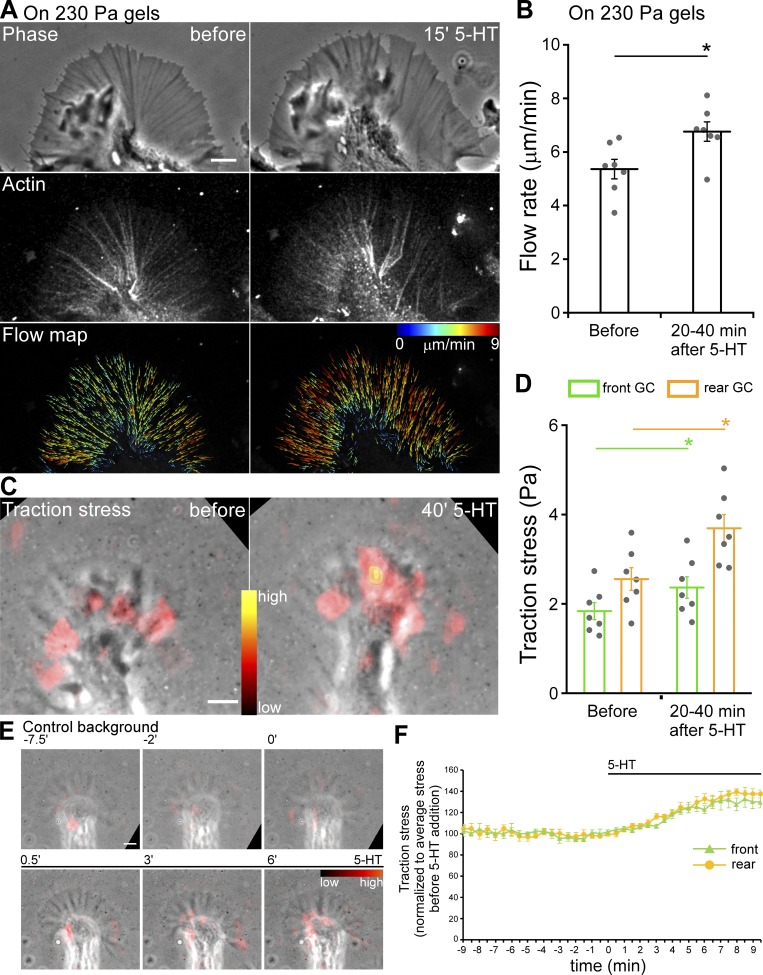
5-HT treatment results in increased traction stress and retrograde F-actin flow rates. (A) Phase image (top), Alexa Fluor 594–phalloidin FSM (middle) and corresponding F-actin flow maps (bottom) before (left) and after (right) 5-HT (10 µM, 15 min) on PA soft gels (230 Pa). Images acquired every 5 s with 2.5-min elapsed recording time. Flow map colors encode speed (see scale bar), and arrows indicate flow direction. Scale bars, 5 µm. See also Video 7. (B) Summary of P-domain retrograde flow rates in response to 5-HT (10 µM, 20–40 min) on PA soft gels (230 Pa); data are mean (μm/min) ± SEM. Number of growth cones evaluated: seven, pooled from three independent experiments. *, P < 0.001 with two-tailed paired t test. (C) Overlay of traction stress maps and phase images of a growth cone (GC) before (left) and after (right) 5-HT (10 µM, 40 min). Images acquired every 30 s with 3-min elapsed recording time for each condition. Color shows relative traction stress magnitude (see color bar). Scale bar, 5 µm. See also Video 8. (D) Summary of mean traction stresses measured in front versus rear growth cone regions (compare Fig. S4 A) before and after 5-HT (10 µM, 20–40 min). Data are mean (Pa) ± SEM. Number of growth cones evaluated: seven, pooled from four independent experiments. *, P < 0.001 with two-tailed paired t test. (E) Overlay of traction stress map and phase image of a growth cone before and after 5-HT (10 µM) addition. Images acquired every 30 s with 18.5-min elapsed recording time. Elapsed time shown at the top of time lapse montage in min. Color indicates traction stress magnitude (see color bar). Scale bar, 5 µm. See also Video 9, right. (F) Time course of mean traction stresses assessed in front and rear growth cone regions before and after 5-HT (10 µM) addition (compare Fig. S4 A). Traction stress normalized to average stress before 5-HT addition. Data are mean (%) ± SEM. Number of growth cones evaluated: five, pooled from five independent experiments. Black bars indicate 5-HT addition. See also Video 9, right.

