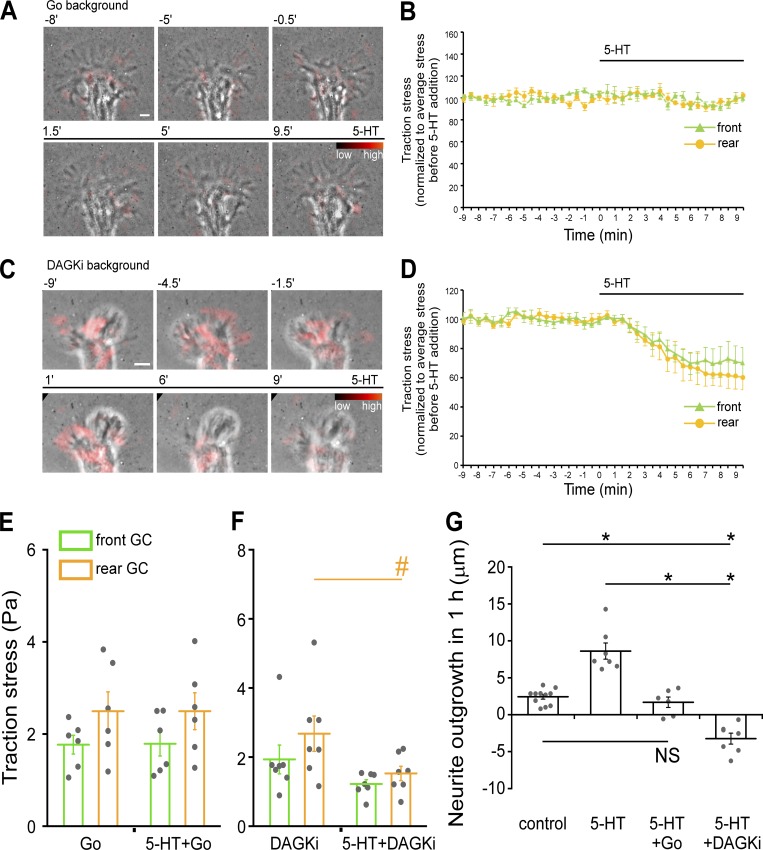
Figure 9.
PKC modulates traction stress and 5-HT response polarity. (A) PKC inhibition: traction stress maps in Go background (Go 5 µM, 30-min pretreatment) overlaid on phase image before and after 5-HT (10 µM) addition in the continued presence of Go. Images acquired every 30 s with 18.5-min elapsed recording time. Elapsed time (in minutes) shown at the top. Color indicates traction stress magnitude (see color bar). See also Video 10, left. (B) Mean traction stress in front and rear of growth cone regions (as defined in Fig. S4 A) before and after 5-HT (10 µM) addition with PKC inhibition (Go 5 µM, 30-min pretreatment and continued presence after 5-HT addition). Traction stress normalized to average stress before 5-HT addition. Data are mean (%) ± SEM. Number of growth cones evaluated: four, pooled from four independent experiments. Black bars indicate 5-HT addition. See also Video 10, left. (C) PKC potentiation: overlay of traction stress map and phase image of a growth cone before and after 5-HT (10 µM) addition in the continued presence of DAGKi (5 µM, 30-min pretreatment). Image acquisition as in A. See also Video 10, right. (D) Summary of mean traction stress in the front and rear of growth cones before and after 5-HT (10 µM) addition in DAGKi backgrounds (DAGKi 5 µM, 30-min pretreatment and continued after 5-HT addition). Traction stress normalized to average stress before 5-HT addition. Data are mean (%) ± SEM. Number of growth cones evaluated: five, pooled from five independent experiments. Black bars indicate 5-HT addition. See also Video 10, right. (E) Mean traction stresses before and after 5-HT (10 µM, 30–60 min) with PKC inhibition. Cells were pretreated with Go (5 µM) for 30 min; Go was present during 5-HT treatment. Traction stresses are average value of mean stresses measured under each condition. Data are mean (Pa) ± SEM. Number of growth cones evaluated: six, pooled from four independent experiments. (F) Mean traction stress in the front and rear of growth cones before and after 5-HT (10 µM, 30–60 min) with PKC potentiation. Cells were pretreated with DAGKi (5 µM) for 30 min; DAGKi was present during 5-HT treatment. Stress data are mean (Pa) ± SEM. Number of growth cones evaluated: seven, pooled from five independent experiments. #, P < 0.05 with two-tailed paired t test. (G) Neurite outgrowth data sampled for 1-h periods on soft PA gels (230 Pa) under control conditions, 5-HT (10 µM); PKC inhibition, Go (5 µM) 30-min pretreatment followed by 5-HT (10 µM) addition in continued Go; or PKC potentiation, DAGKi (5 µM) 30-min pretreatment followed by 5-HT (10 µM) addition in continued DAGKi. Data are mean (μm) ± SEM. Number of neurites evaluated: 11, 7, 6, and 7 for control, 5-HT, 5HT+Go, and 5-HT+DAGKi, pooled from four, three, three, and three independent experiments, respectively. P = 1.25 × 10⁻¹⁰ with single-factor ANOVA. *, Significant difference using Tukey’s HSD post hoc analysis. Scale bar, 5 µm.

