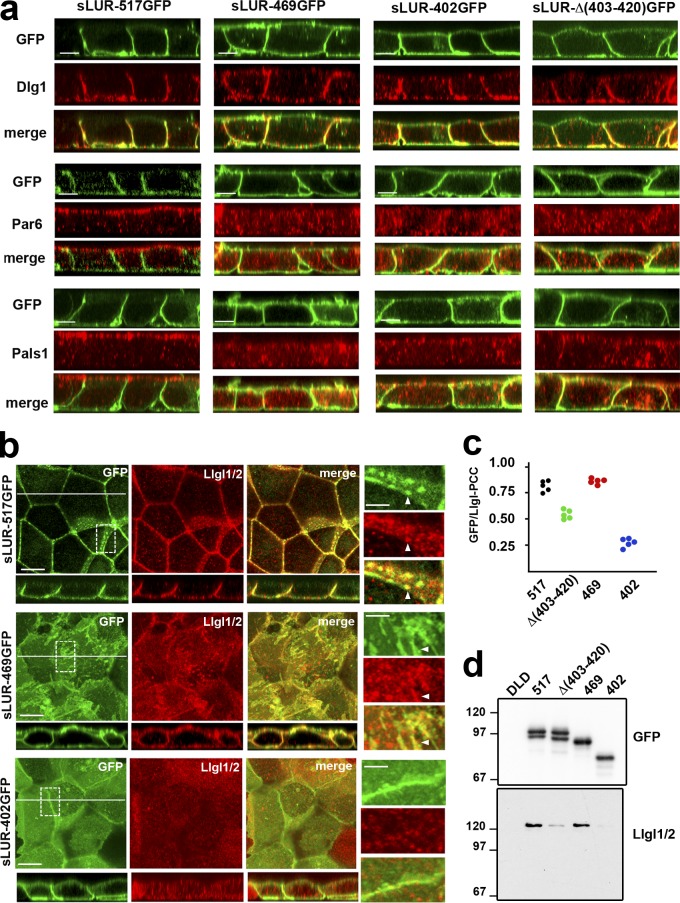
Figure 10.
Polarity markers in DLD20-2 cells expressing different sLUR mutants. (a) Representative z-sections of DLD20-2 cells expressing sLUR-517GFP, sLUR-469GFP, sLUR-402GFP, and sLUR-Δ(403–420). The cells were imaged for GFP fluorescence (green) in conjunction with immunostaining for Dlg1, Par6B, and Pals1 (all red). Bars, 10 µm. Note that neither of the sLUR-517GFP mutants rescues ABP of DLD20-2 cells. (b) The cells were imaged for GFP (green) and for Llgl1/2 (red). x-y projections of three optical z slices spanning only 1.2 µm of the apical cell regions are shown. The entire optical cross-sections of these cells along the white lines are at the bottom. Bars, 10 µm. Dashed boxes show regions of higher magnifications (right). Note that some GFP and Llgl1/2 clusters are colocalized (arrowheads). (c) PCC values between green (GFP) and red (Llgl1/2) fluorescence of the random optical z slices of the images shown in b. (d) Western blot of the anti-GFP precipitates obtained from the confluent cultures of the control DLD cells and DLD20-2 cells expressing sLUR-517GFP mutants (marked as in Fig. 8, c and d) probed for GFP and Llgl1/2.

