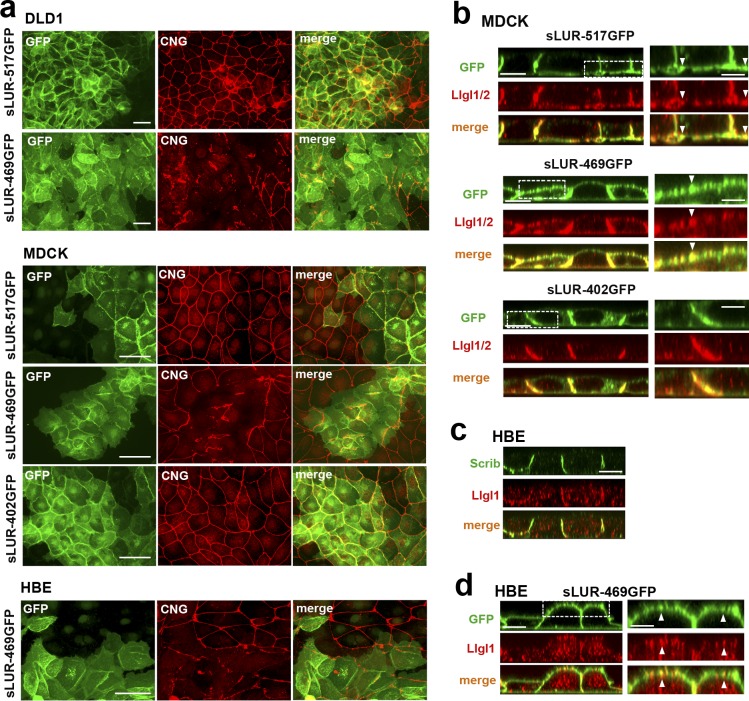
Figure 9.
Dominant-negative effect of the LAPSDb-deficient mutant. (a) Representative widefield images of DLD1, MDCK, and HBE cells expressing different sLUR mutants (indicated on the left) imaged for GFP (green) and CNG (red). The cells were cultured 48 h before staining. Note that the cells expressing the LAPSDb-deficient mutant, sLUR-469GFP, but not other mutants exhibit dramatic disintegration of TJs. Bars, 30 µm. (b) Representative optical z-sections of MDCK cells expressing the full-length sLUR (sLUR-517GFP), and its mutants sLUR-469 GFP and sLUR-402GFP stained for Llgl1/2 (red). Note apical localization of Llgl1/2 in cells expressing sLUR-469GFP. Bars, 10 µm. The boxed regions are zoomed on the right panel. Bars, 3 µm. Note partial colocalization of the mutant and Llgl1/2 (arrowhead). (c) WT HBE cells stained for hScrib (Scrib) and Llgl1. Note the absence of both at the apical cortex. (d) HBE cells expressing sLUR-469GFP imaged for GFP and Llgl1. Note apical enrichment of both proteins. Bar, 10 µm. The boxed area is zoomed on the right. Bar, 5 µm.

