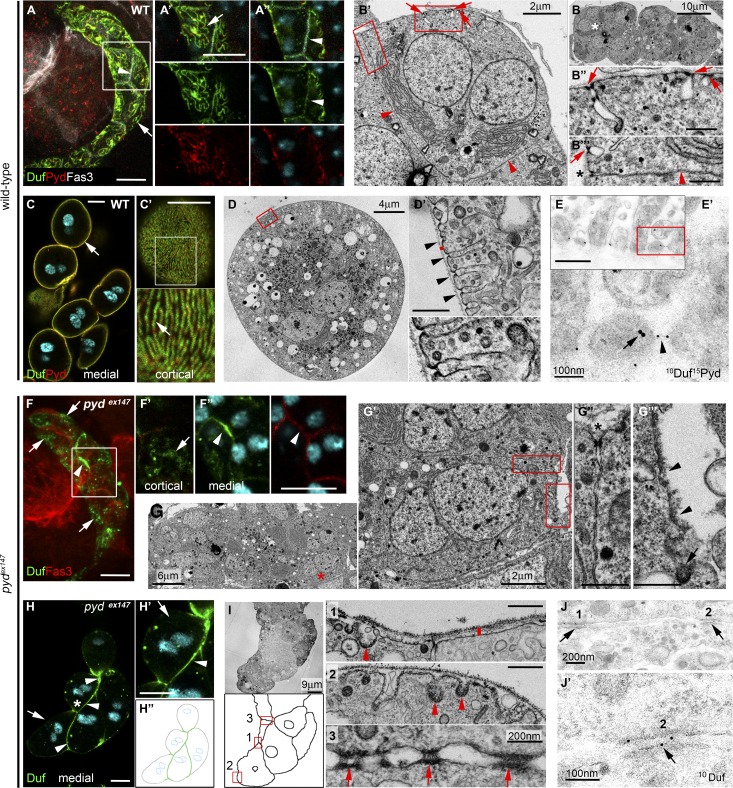
Figure 1.
Pyd localizes at the nephrocyte SD and is required for its formation. (A–A″) Confocal images of midtransverse (MT) optical section (A″) or z-projections (A and A′) of stage-16 WT nephrocytes stained with the indicated antibodies. Arrows point to Duf/Pyd at SDs and arrowheads to Duf/Fas3 at cell contacts. See also Video 1 and Fig. S1. (B–B′″) TEM images of MT sections in stage-16 WT nephrocytes. Asterisk in B marks the cell in B′. Arrows point to SDs and arrowheads to cell contacts. Asterisk in B′″ marks a junction at the external region of apposed cell membranes (n = 10). (C and C′) Single sections of WT larval nephrocytes stained for Duf, Pyd, and DAPI (cyan). Arrow points to Duf/Pyd at the external membrane (C) with a fingerprint-like distribution (C′; n = 129 nephrocytes [N]/12 strings [S]). (D and D′) TEM images of a WT larval nephrocyte; arrowheads point to SDs, and the height of the red bar indicates the width of the BM (n = 24). (E and E′) TEM images of a larval nephrocyte immunogold-stained for Duf and Pyd (n = 3 independent experiments). Duf localizes at the SD junction (arrowhead) and Pyd at the SD cytoplasmic side (arrow). (F–F″) z-projection (F) and single sections (F′ and F″) of stage-16 pydEx147 nephrocytes stained for Duf and Fas3 (n = 231N). Arrows point to Duf at external patches and arrowheads to Duf/Fas3 at cell contacts. (G–G′″) TEM images of stage-16 pydEx147 nephrocytes. Asterisk in G″ marks a cell junction; arrowheads in G″′ point to the plasma membrane lacking SDs and the arrow to a clathrin-coated pit. The red asterisk marks the cell shown in G′ (n = 25). (H–H″) MT sections and cartoon of larval pydEx147 nephrocytes stained for Duf. The asterisk points to the cell shown in H′, arrowheads to Duf at cell contacts, and arrows to the external membrane lacking Duf (n = 83N/8S). (I) TEM images and cartoon of larval pydEx147 nephrocytes. Note the absence of SDs and the presence of clathrin-coated pits (arrowheads) and junctional complexes between nephrocytes (arrows). The bar denotes the width of the BM (compare to D′) and the squares the regions magnified in nearby panels. (J and J′) Immunoelectron micrographs of pyd-silenced larval nephrocytes stained for Duf. Arrows point to Duf at junctional complexes. Unless otherwise indicated, white and black scale bars represent 10 µm and 500 nm, respectively.

