Figure 3.
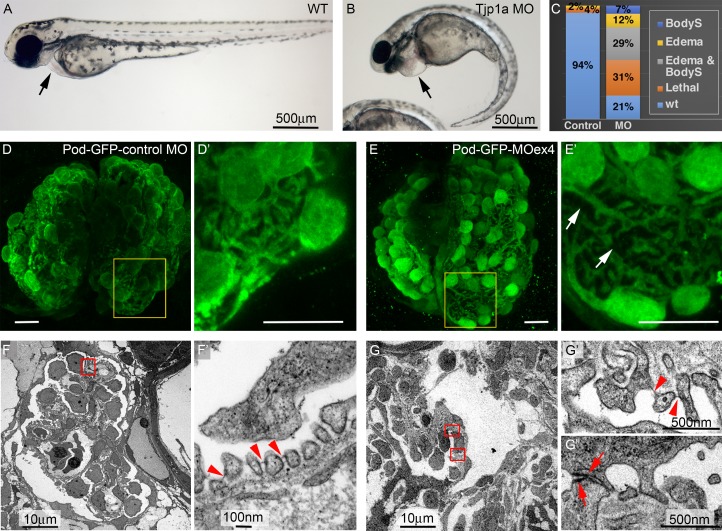
Tjp1a is required for SD stability in zebrafish. (A and B) WT and tjp1aMOex4 72-hpf larvae showing pericardial edema (arrow in B, compare to A) and body-axis curvature (BodyS) in the morphant. (C) Quantification of morphant phenotypes (n = 82 and 215 for control MO and MOex4). (D–E′) z-projections of 96-hpf control MOpod-GFP (D and D′) and MOex4pod-GFP (E and E′) whole-mount glomeruli stained for GFP reveal wider gaps due to retraction of foot processes in the morphant (arrows in E′, compare to D′; n = 7). (F–G″) TEM images of glomeruli (F and G) and filtration barrier (F′, G′, and G″) in control MO pod-GFP (F and F′) and MOex4 pod-GFP 5 dpf larvae (G–G″). Arrowheads point to the regular array of foot processes and SDs in the control (F′; n = 2) and scarcity of SDs in the morphant (G′; n = 2). Arrows in G″ point to junctional complexes between abnormally broad processes (7 junctions per ultrathin glomerular section; n = 3, versus 0.3 in the controls; n = 3). White scale bars represent 10 µm.

