Figure 3.
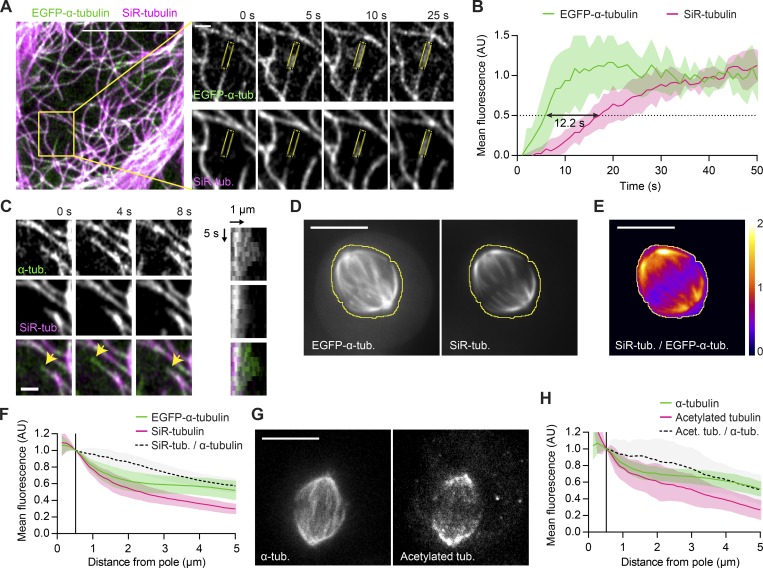
SiR-tubulin is a live-cell marker for long-lived MT stretches. (A) Live interphase HeLa cell expressing EGFP-α-tubulin incubated with 100 nM SiR-tubulin imaged at 1 s/frame (see Video 4). Insets show a typical MT growth event (scale bar, 1 µm); mean fluorescence intensities were quantified in ROIs as illustrated (yellow). (B) Quantification of mean fluorescence in growing MTs as illustrated in A (n = 13 MTs in 9 cells; individual profiles normalized to the mean values measured at t >30 s). Black arrow indicates lag time between the 50% fluorescence value of EGFP-α-tubulin and SiR-tubulin, respectively. (C) Selected example of a growing MT undergoing a catastrophe event (arrowheads point to EGFP-labeled growing tip). A kymogram is shown on the right. (D–F) A live EGFP-α-tubulin–expressing HeLa cell incubated with 50 nM SiR-tubulin. The yellow line denotes the spindle boundary. (E) Ratiometric image of SiR-tubulin/EGFP-α-tubulin, calculated based on temporal projections of 30-s videos for the cell shown in D. (F) Mean fluorescence intensities in interpolar regions quantified as in Fig. 1 (B and C; n = 35 cells). (G and H) Acetylated tubulin and α-tubulin visualized by immunofluorescence in metaphase spindles of HeLa cells (n = 26 cells imaged in two independent experiments). (H) Mean fluorescence intensities quantified in interpolar regions as in Fig. 1 (B and C). Lines and shaded areas denote mean ± SD, respectively. Scale bars represent 10 µm unless otherwise indicated. AU, arbitrary units.

