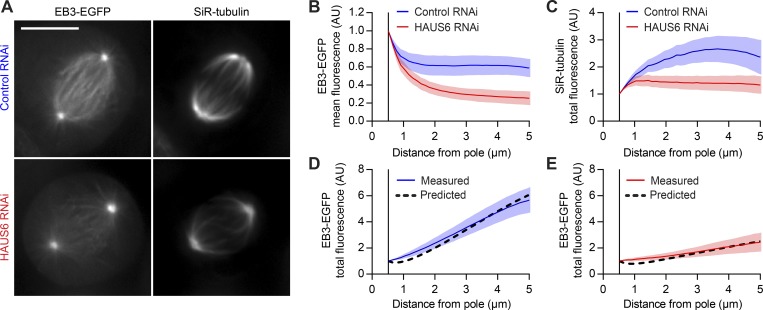
Figure 4.
Augmin-mediated MT amplification explains most of the plus end distribution in the metaphase spindle. (A) EB3-EGFP–expressing HeLa cells transfected with either nontargeting (control) or HAUS6-targeting siRNAs were incubated with 100 nM SiR-tubulin; average-intensity projections of registered videos. (B and C) EB3-EGFP (B) and SiR-tubulin (C) fluorescence, quantified as in Fig. 1 (B and C; n = 32 and 35 cells for control and HAUS6 RNAi cells, respectively). SiR-tubulin fluorescence in interpolar spindle regions (C) served as amplification template in a mathematical simulation of MT plus end density (see Fig. S5 C and Materials and methods for details). (D and E) Comparison between the predicted distributions of MT plus ends (black dashed line) and the measured EB3-EGFP total fluorescence for control (D) and HAUS6 RNAi (E) cells. Lines and shaded areas denote mean ± SD, respectively. Scale bars represent 1 µm unless otherwise indicated. AU, arbitrary units.

