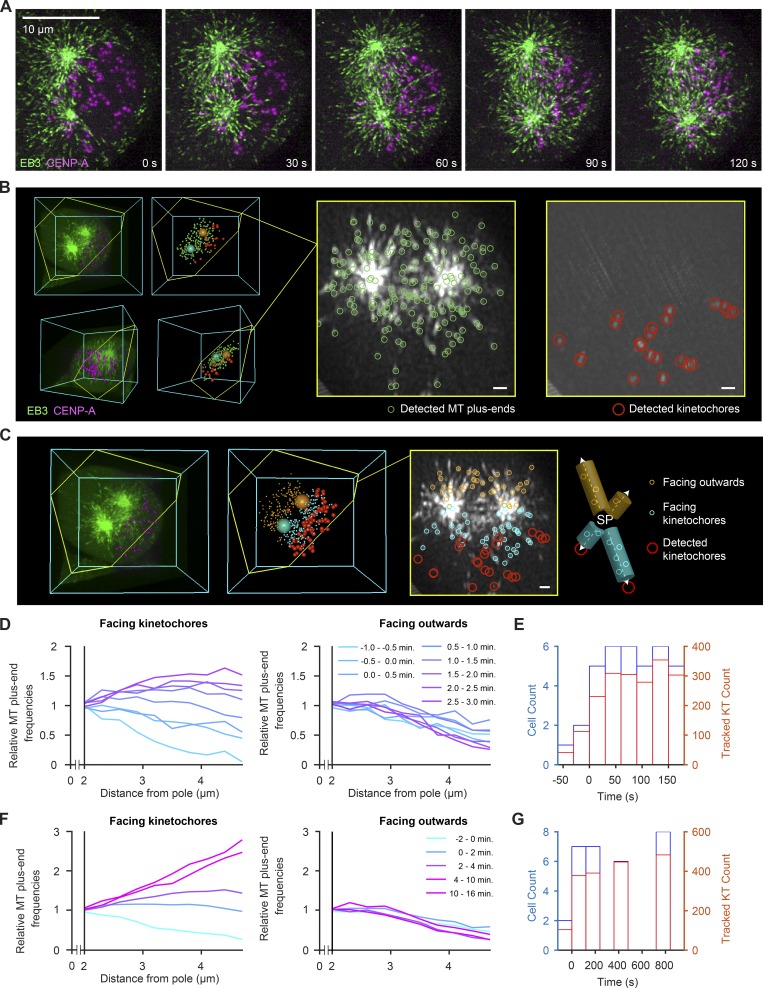
Figure 5.
Noncentrosomal MTs increase in spindle regions facing toward KT already during early prometaphase. (A–C) HeLa cell expressing EB3-EGFP (green) and mCherry-CENPA (magenta), imaged during prometaphase by 3D lattice light-sheet microscopy. (A) Maximum-intensity projections of deconvolved video frames (t = 0 s, nuclear envelope disassembly). (B) Automated 3D detection of MT plus ends and KTs in EB3-EGFP and CENP-A images, respectively. The slice highlighted in yellow follows the plane defined by the spindle poles and a randomly chosen KT. The thickness of the projection is 600 nm. (C) Distribution of plus ends mapped to regions “facing KTs” and “facing outward.” MT plus ends facing KTs are mapped in 500-nm-wide cylinders around individual pole–KT axes, whereas MT plus ends facing outward are mapped to “mirror” cylinders facing the opposite direction. (D) Quantification of detected MT plus ends at increasing distances from the nearest spindle pole throughout early prometaphase (t < 5 min, n > 268 video frames analyzed per minute). Counts in individual cells are normalized to the value at 2 µm distance (lines denote mean; n = 9 cells). (E) Histograms of cell and KT counts for data shown in D. (F) Quantification of MT plus ends from early prometaphase to metaphase. Counts in individual cells are normalized to the value at 2 µm distance from the pole (lines denote mean, n = 22 cells). (G) Histograms of cell and KT counts for data shown in F. Scale bars, 10 µm.

