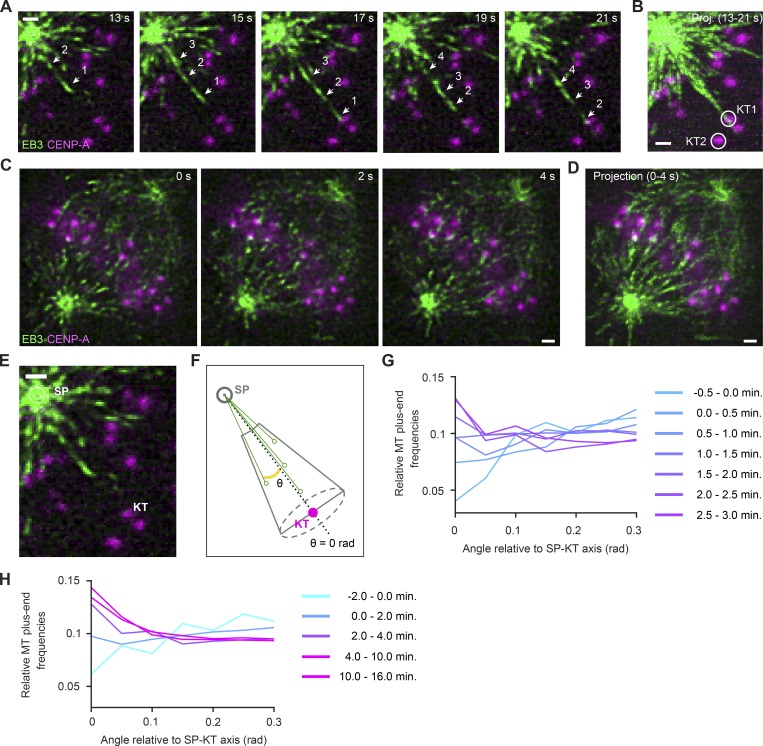
Figure 6.
MT growth direction is highly biased toward KTs. (A–E) Lattice light-sheet microscopy of EB3-EGFP and mCherry-CENPA–expressing HeLa cells. Scale bars, 1 µm. (A and B) KT-directed MT growth in an early prometaphase cell; detail of video shown in Fig. 5 A (t = 0 s, nuclear envelope disassembly). (A) Each frame is a maximum-intensity projection of five z-sections, the center section being the focal place of the KT highlighted in B (KT1, circle). A series of MT plus ends are shown growing toward the KT (arrows). (B) Maximum-intensity projection of video shown in A. (C) KT-directed MT growth in a metaphase cell imaged at one stack of 50 z-sections/s. Each frame shows a single z-section. (D) Temporal projection of a 4-s interval, as shown in C. (E and F) Illustration of assay for automated quantification of MT growth direction relative to pole–KT axes. (E) Spindle poles and KTs were automatically detected as in Fig. 4 to calculate conical ROIs centered on pole–KT axes. MT plus ends at a distance <2 µm to the pole were not considered, as they were not reliably resolved as individual objects. (F) MT plus ends were mapped in conical ROIs, and for each, the angle of an axis connecting to the spindle pole was calculated relative to the pole–KT axis. Solid green circles on black arrows illustrate radial positions of MT plus ends. (G and H) Radial distributions of MT plus ends relative to spindle pole–KT axes. Each curve represents data from all detected KTs (sampled as described in Fig. 5, E and G) and MT plus ends for the indicated time interval relative to nuclear envelope disassembly (0 min). SP, spindle pole.

