
Figure 1.
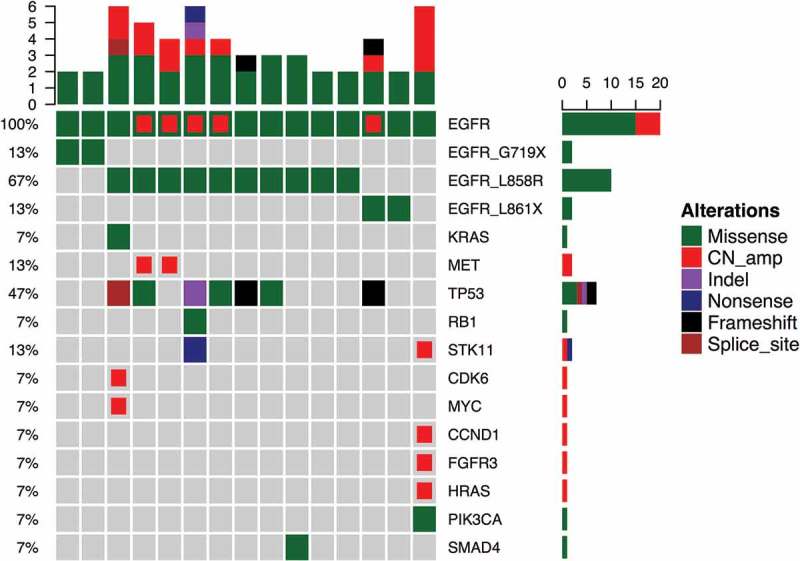
Mutational Profile of the 15 patients with compound EGFR mutations.
Each column represents a patient and each row represents a gene. Top bars represent the number of mutations a patient carried and sidebars represents the percentage of patients with a certain mutation. Different colors denote different types of mutation.